
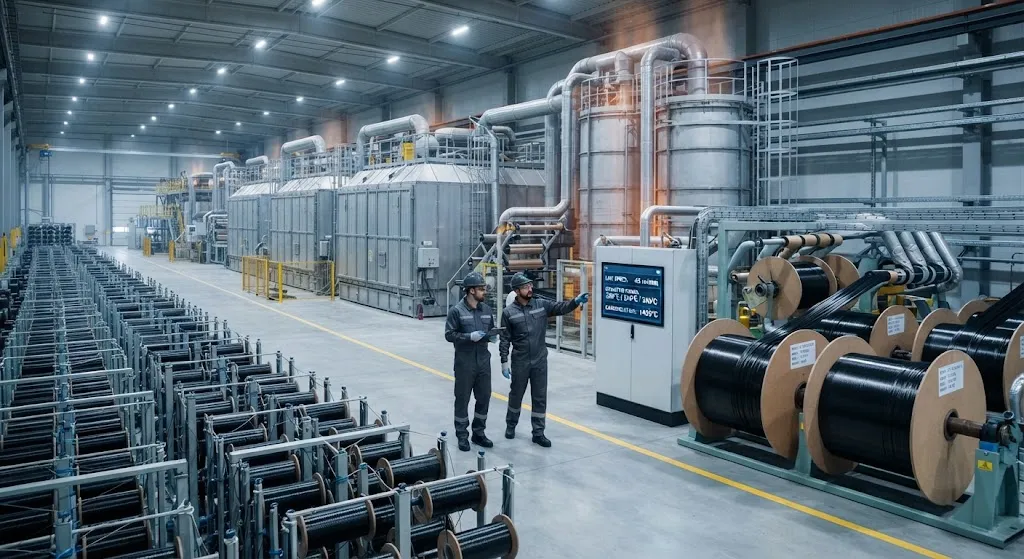
The global carbon fiber industry crossed a structural milestone in 2025. The ATA 2025 annual carbon fiber market report records worldwide operating capacity of 326,080 tonnes, and for the first time in the industry's history China accounts for more than half of it: 171,080 tonnes, or 52
Introduction
The global carbon fiber industry crossed a structural milestone in 2025. The ATA 2025 annual carbon fiber market report records worldwide operating capacity of 326,080 tonnes, and for the first time in the industry's history China accounts for more than half of it: 171,080 tonnes, or 52.5% of the total supply base. That single statistic changes how every downstream buyer should read the market, because capacity location determines price floors, lead times, and supply security far more than headline market growth does.
This article maps where the 326,080 tonnes actually sit, explains why China reached the halfway mark so quickly, and addresses what industry analysts call the nominal-versus-effective capacity gap — the difference between what plants can theoretically produce and what they actually do. For procurement teams negotiating fiber supply in 2026-2027, understanding that gap matters more than memorizing the headline capacity number.
The 326,080 t Capacity Base
Operating capacity measures lines that can produce carbon fiber today, excluding mothballed or permanently closed capacity. The table below summarizes the regional distribution reported in the ATA 2025 survey. Shares for regions other than China are approximate, since individual national totals are aggregated across private producers, but the overall base sums to the reported 326,080 tonnes.
| Region | Operating capacity (t) | Share of global base | Character of supply |
|---|---|---|---|
| China | 171,080 | 52.5% | Standard modulus, 12K-48K, large-tow for wind and industrial use |
| Japan | 44,000 (approx.) | 13.5% | Aerospace-grade small tow, T700-T1100, IM and HM grades |
| Europe | 39,100 (approx.) | 12.0% | Aerospace tow and prepreg, niche specialty grades |
| North America | 29,350 (approx.) | 9.0% | Aerospace and defense, plus large-tow for industrial segments |
| South Korea | 27,700 (approx.) | 8.5% | IM and HM grades, aerospace, pressure vessels |
| Rest of Asia and others | 14,850 (approx.) | 4.5% | Standard modulus, regional industrial supply |
Three observations stand out. China now holds a majority that no other country has ever held since carbon fiber became a commercial product. The traditional Japanese producers — regardless of their global leadership in technology — represent a shrinking minority share of raw tonnage. And the diversity of the remaining base means that supply security depends less on total capacity and far more on grade availability: aerospace-grade small tow remains concentrated outside China, while industrial-grade standard modulus is now overwhelmingly a Chinese market.
How China Reached 52.5%
The majority share did not come from a single dramatic expansion but from a sustained build-out over the past decade. Chinese producers scaled PAN-based lines aggressively between 2016 and 2025, driven by government industrial policy, domestic wind turbine manufacturing, and a national drive to localize a material previously dominated by importers. Provincial investment incentives and guaranteed demand from state-linked infrastructure projects reduced the financial risk of multi-million-dollar line installations.
The result is a supply base where the largest single national block is also the youngest. A meaningful share of Chinese capacity consists of 12K-48K industrial-grade lines built within the last five years, many of them scaled to feed wind blade spar caps and other high-volume applications rather than aerospace programs. That profile explains why China's capacity share and China's price effect on global markets have moved together.
- Standard modulus concentration: The majority of Chinese tonnage competes in the T300-class segment, the same segment where global spot prices fell from $33 per kilogram in 2022 to roughly $12 by the end of 2024.
- Large-tow orientation: 24K and 48K lines dominate new Chinese investment, matching the feedstock needs of pultruded spar caps, pressure vessels, and construction reinforcement.
- Export ambitions: As domestic industrial demand matures, Chinese producers are increasingly visible in export markets, pressing on the pricing power of every other region.
Nominal vs Effective Capacity: the Gap That Matters
Capacity maps tell buyers what could be produced, not what is produced. The nominal-versus-effective gap is the difference between nameplate line ratings and the volume actually manufactured, limited by raw material supply, utilization rates, and grade yield. The ATA 2025 data reports operating capacity, which is tighter than nameplate capacity, but even operating capacity overstates reality when lines run below full utilization.
For the wind energy supply chain this distinction is decisive. Wind demand jumped 127.3% in a single year to cross 100,000 tonnes in 2025, yet the market did not run out of fiber. That apparent contradiction is explained partly by underutilized Chinese capacity flexing upward and partly by inventory drawdown. A buyer who plans around effective capacity — capacity actually committed and running — will set more realistic lead times than one who multiplies nameplate figures by a standard utilization assumption.
Two structural factors keep the effective number below the nominal number. First, PAN precursor supply is a bottleneck: carbonization lines exceed precursor availability in several regions, capping output regardless of line rating. Second, grade yield varies: a line nominally rated for 3,000 tonnes per year of standard modulus fiber produces far less when switched to IM or HM grades, which require slower processing and lower throughput. Effective capacity is therefore not one number but a curve that shifts with the product mix.
Regional Dynamics Outside China
Each non-Chinese region faces a different version of the same question: how to defend a position in a market where the largest supplier is also the lowest-cost one for standard modulus product.
- Japan: Producers defend on performance — T800-class and T1100-class grades, IM and HM fibers, and aerospace qualification — rather than on price. Japanese capacity is expected to remain stable, with investment directed at premium grades.
- Europe: Capacity is largely tied to aerospace programs and to specialty grades such as thermoplastic composites and recycled fiber lines. European producers focus on traceability and sustainability regulations, differentiating on circularity rather than tonnage.
- North America: Defense demand and aerospace recovery underpin large-tow and small-tow lines alike, with government support for domestic production strengthening the case for relocating some supply chains.
- South Korea: IM and HM capacity geared to pressure vessels, satellites, and increasingly to the mobility sector, with exports heavily weighted toward higher-value grades.
The common thread is that every region outside China has repositioned toward grades, certifications, and applications where Chinese standard-modulus scale does not compete directly. For buyers, the practical consequence is a two-tier market: commodity grades with global oversupply, and premium grades with genuinely constrained supply.
What the Capacity Map Means for Buyers
The 2026 capacity map changes procurement strategy in four ways. First, commodity-grade standard modulus fiber should be negotiated against Chinese spot pricing, with global competition keeping the ceiling low. Second, aerospace and IM/HM grades remain a seller's market: qualification barriers, not capacity, are the binding constraint, so multi-source qualification is a strategic hedge worth the certification cost. Third, the nominal-versus-effective gap should be built into lead-time planning — a supplier quoting from nameplate capacity is quoting optimism. Fourth, the ratio of wind demand (44.5% of total consumption) to capacity means supply flexibility for blades will be a recurring tension: fiber follows aerospace margins when they are strong and wind volume when it peaks, and buyers benefit from locking volumes early in the year.
Frequently Asked Questions
What is the difference between nominal, operating, and effective carbon fiber capacity?
Nominal capacity is the nameplate rating a line was designed for. Operating capacity — the figure the ATA 2025 report uses for its 326,080-tonne total — excludes lines that are mothballed or permanently closed. Effective capacity is the volume actually produced, limited by PAN precursor availability, utilization rates, and the grade mix running on the line. For standard modulus industrial fiber, effective output can run 20-40% below nameplate in underutilized periods, while premium-grade switches reduce throughput even further.
Why does China's 52.5% capacity share not translate into 52.5% of global production?
Capacity share measures installed line ratings, not output. Chinese standard-modulus lines have run at utilization rates well below 100%, particularly during price weakness in 2023-2024, and some lines are standing available capacity built ahead of demand. Production share also depends on which grades are actually manufactured, because higher-grade output requires slower processing. In practice China's production share has tracked its capacity share upward, but the two numbers move with a lag and a utilization discount.
How should a buyer respond to the new capacity map when negotiating supply agreements?
Split the negotiation by grade tier. For standard modulus commodity fiber, benchmark against Chinese spot pricing and multi-source among at least two regions to compress the premium. For aerospace or IM/HM grades, expect terms driven by qualification status rather than capacity, and agree annual volume floors early — especially in years when wind demand spikes, because large-tow capacity flexes toward whichever buyer commits first. Include utilization and lead-time clauses that the supplier must honor if effective capacity falls short of the volumes forecast.
Conclusion
The 2026 global carbon fiber capacity map is defined by one fact: China's 171,080 tonnes of operating capacity, 52.5% of a 326,080-tonne base, is now the dominant supply anchor of the industry. Standard modulus fiber is a global oversupply market with a Chinese price floor; premium grades remain scarce and qualification-bound; and the nominal-versus-effective gap, not the headline number, determines whether wind and industrial buyers actually get the fiber they plan for.
For procurement teams, the practical takeaway is to manage two parallel tracks: commodity volume procurement priced against the Chinese market, and premium-grade qualification programs run well ahead of need. Review our carbon fiber product range, from standard modulus to high-modulus grades, or contact our supply team to map your requirement against today's effective capacity picture.
Part of topic
Related Articles
- Recycled Carbon Fiber Market Forecast 2030: Technology Maturity and Commercialization Path
- South Korea Carbon Fiber Market 2026: Hydrogen Economy and Shipbuilding Innovation
- Wind Turbine Blade Leading Edge Protection 2026: Polyurethane, Tape, and Metallic Shield Solutions
- China Carbon Fiber Overcapacity 2026: Price War Impact and Industry Consolidation
- India Carbon Fiber Market 2026: Wind Energy, Aerospace, and Defense Expansion
- PAN Precursor Market 2026: Acrylonitrile Supply and Carbon Fiber Cost Structure
Interested in Our Products?
Contact our team for competitive pricing and technical specifications.
Get a QuoteRelated Products

Carbon Fiber Fishing Rod Blank
High-quality carbon fiber fishing rod blank manufactured from multiple grades of Toray carbon fiber cloth. Available in a wide range of lengths, powers, and actions for freshwater and saltwater applications. Suitable for OEM rod building.
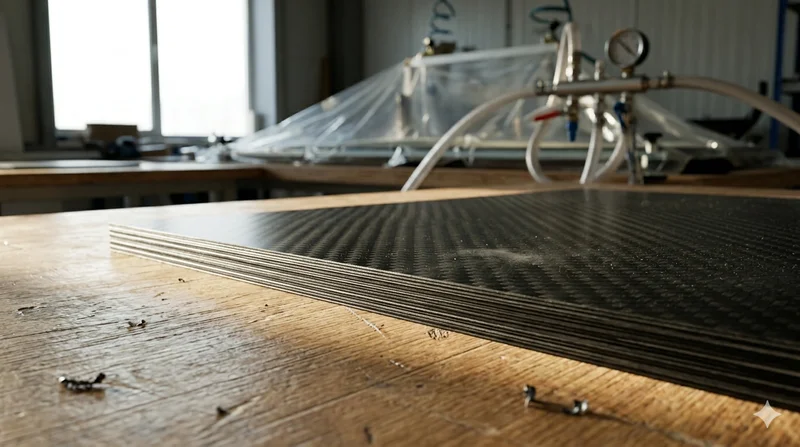
Carbon Fiber Plate — 3K Twill T700 3.0mm
Medium-thickness 3.0mm carbon fiber plate offering significantly higher load capacity while maintaining attractive 3K twill finish. Suitable for structural brackets, reinforcement plates, and load-bearing panels.
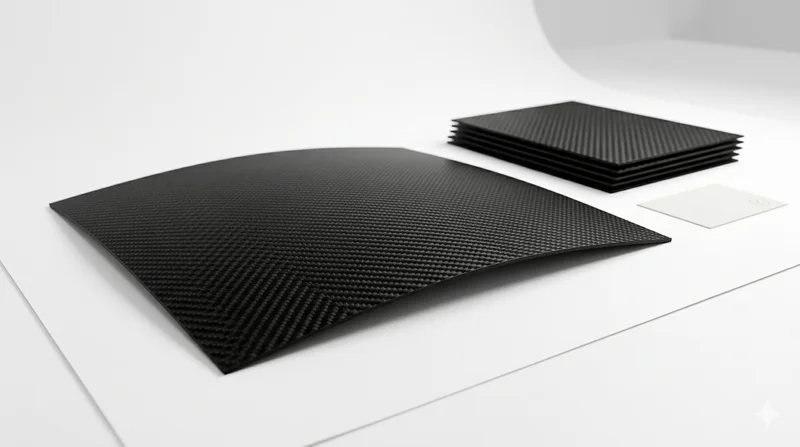
Carbon Fiber Plate — 3K Twill T700 1.5mm
Thin 1.5mm carbon fiber plate with 3K twill weave surface. Lightweight and stiff, commonly used for covers, panels, drone bodies, and applications requiring a premium aesthetic appearance.

Square Carbon Fiber Tube — 3K Twill T700
Square cross-section carbon fiber tube manufactured with 3K twill weave for torsional strength. Preferred for structural frames, trusses, and support columns where rectangular geometry offers design flexibility.

Carbon Fiber Drone Arm
Precision-molded carbon fiber drone arm combining unidirectional fiber for stiffness and woven layers for torsional strength. Designed for FPV, photography, and industrial drone platforms. Each arm is CNC-machined to exact specifications.