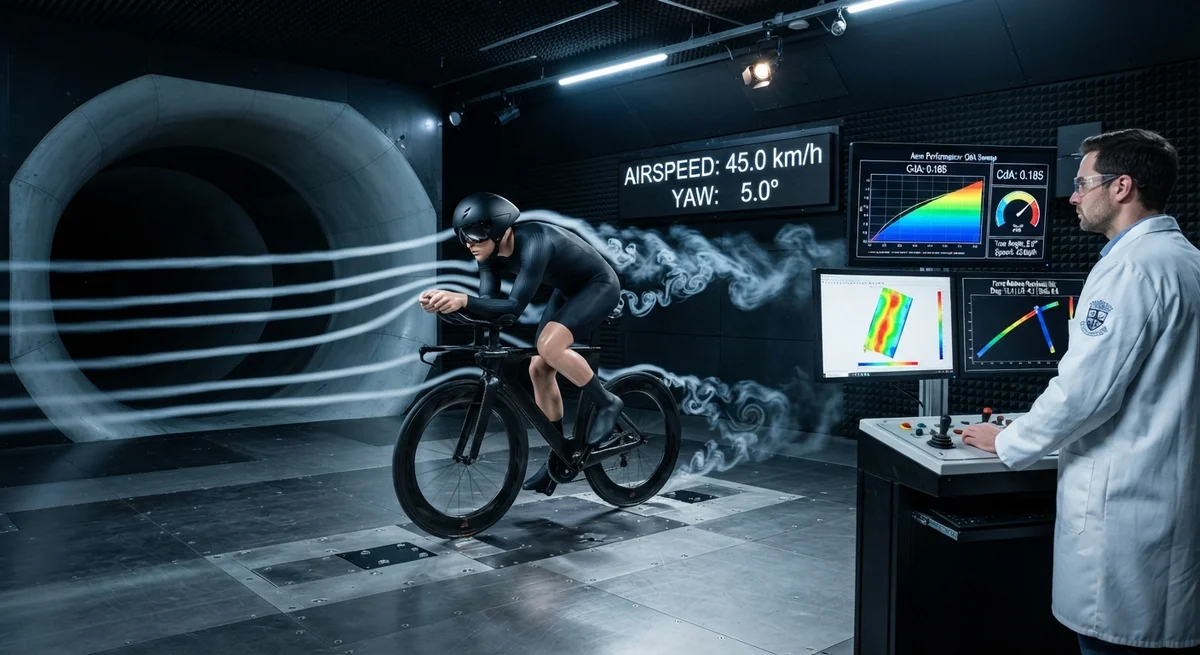
Wind tunnel testing is the definitive method for optimizing carbon fiber racing bicycle frame aerodynamics. This article examines test protocols, data analysis, and real drag reduction results from CFD and physical tunnel validation.
Introduction: The Aerodynamic Imperative in Racing Bicycles
At racing speeds above 40 km/h, aerodynamic drag accounts for 80-90% of the total resistance a cyclist must overcome. For a rider producing 300 watts at 45 km/h on a flat road, approximately 250 watts is consumed overcoming air resistance — with roughly 65-75% of that drag attributable to the rider and 25-35% to the bicycle. The frame alone contributes 8-15% of total system drag, making frame aerodynamics a critical optimization target for racing bicycle manufacturers. Carbon fiber's unique formability — its ability to be molded into complex aerodynamic airfoil shapes that would be prohibitively expensive in metal — has made it the exclusive material for high-performance racing frames. This article provides bicycle brand engineers and procurement specialists with a detailed methodology for wind tunnel testing of carbon fiber racing frames, from CFD simulation through physical tunnel validation.
The global racing bicycle market was valued at approximately USD 9.2 billion in 2025, with aerodynamic frames representing the highest-value segment at $2,800-$12,000+ retail per frameset. The cost of aerodynamic development — CFD simulation ($20,000-$80,000 per design iteration), prototype fabrication ($3,000-$8,000 per frame), and wind tunnel validation ($1,000-$3,000 per test hour) — is justified by the measurable performance benefit: a 5% reduction in frame drag saves a rider approximately 12-15 seconds over a 40 km time trial at 45 km/h.
CFD Simulation: The First Stage
Computational fluid dynamics (CFD) simulation is the first stage of aerodynamic development for carbon fiber racing frames. Modern CFD tools (ANSYS Fluent, OpenFOAM, STAR-CCM+) model the airflow around the frame with the following typical parameters:
| Parameter | Typical Value | Purpose |
|---|---|---|
| Turbulence model | k-ω SST or k-ε RNG | Models transition and separation in the Reynolds number range 10⁵-10⁶ |
| Y+ value (wall treatment) | 1-5 (low-Reynolds wall modeling) | Resolves boundary layer profile at the frame surface |
| Mesh size | 15-40 million cells | Resolution: 0.5-2.0 mm on frame surface, 10-50 mm in far field |
| Inlet velocity | 11.1 m/s (40 km/h) | Representative time trial speed |
| Turbulence intensity | 0.5-2.0% | Simulates outdoor riding conditions (low to moderate wind) |
| Yaw angle range | −15° to +15° | Simulates crosswind conditions |
| Convergence criteria | Residuals <10⁻⁴ for continuity and momentum | Ensures solution stability |
| Computational time | 48-120 CPU-hours per simulation | 72-240 hours on a 32-core workstation |
CFD provides drag coefficient (CdA) values with an accuracy typically within ±3-5% of physical tunnel measurements for the same geometry — sufficient for design direction comparison but not for absolute performance claims. The key outputs are: (1) CdA value at each yaw angle; (2) pressure coefficient distribution on the frame surface — identifying high-drag regions; (3) flow streamlines and vortex structures — revealing separation zones behind the down tube, seat tube, and fork legs; and (4) crosswind stability metrics — side force and yawing moment coefficients.
Wind Tunnel Testing: Protocols and Setup
Physical wind tunnel testing is the gold standard for aerodynamic validation. The following protocol is used by leading bicycle manufacturers (Specialized, Trek, Cervélo, Pinarello) and independent test laboratories.
Test Setup
- Wind tunnel type: Closed-circuit, low-turbulence wind tunnel with a test section cross-section of at least 2.5 m × 2.0 m (to minimize blockage effects — the ratio of frame frontal area to tunnel cross-section should be <5%)
- Balance system: Six-component force balance (drag, lift, side force, pitch, roll, yaw moment) mounted beneath the tunnel floor, connected to the bike via a streamlined strut
- Rider simulation: Anthropomorphic mannequin (standardized for comparability) or live rider. The mannequin approach eliminates rider position variability (which can cause ±2-5% CdA variation). Pedaling motion is simulated with a motor-driven crank (90 rpm) with the rear wheel on a rolling drum
- Wheel specification: Standardized test wheels (e.g., 50 mm deep-section carbon rims with 25 mm tires at 80 psi) to isolate frame aerodynamics from wheel effects
- Data acquisition: 10-second sampling at each test condition, repeated 3 times, averaged. Total test points: 5-10 yaw angles × 4-6 rider positions × 2-3 wheel configurations = 40-180 data points per frame
Yaw Angle Sweep: Typical Results
| Yaw Angle (°) | Baseline Frame CdA (m²) | Optimized Frame CdA (m²) | Drag Reduction (g at 45 km/h) | Power Saving (W at 45 km/h) | Time Saving over 40 km TT (s) |
|---|---|---|---|---|---|
| 0 | 0.205 | 0.192 | 39 | 4.8 | 5.8 |
| ±2.5 | 0.212 | 0.196 | 48 | 5.9 | 7.2 |
| ±5.0 | 0.228 | 0.207 | 63 | 7.8 | 9.5 |
| ±7.5 | 0.250 | 0.223 | 81 | 10.0 | 12.2 |
| ±10.0 | 0.278 | 0.245 | 99 | 12.2 | 14.9 |
| ±12.5 | 0.310 | 0.270 | 120 | 14.8 | 18.1 |
| ±15.0 | 0.345 | 0.298 | 141 | 17.4 | 21.3 |
Note: CdA = coefficient of drag × frontal area. Values shown are representative of a complete rider + bicycle system at 45 km/h (11.1 m/s). The optimized frame shows a weighted-average drag reduction of 6.2% across all yaw angles, weighted by the probability distribution of yaw angles in real riding (typically 58% of riding time at <5° yaw, 30% at 5-10°, 12% at >10° for a flat time trial course).
Frame-Specific Aerodynamic Optimization Parameters
| Frame Zone | Contribution to Frame Drag | Optimization Strategy | Drag Reduction Potential | Design Trade-off |
|---|---|---|---|---|
| Down tube | 22-28% | Kamm-tail truncated airfoil profile; deep section (40-55 mm); integrated bottle/cage | 8-15% | Weight: +50-80 g vs round tube; crosswind stability |
| Seat tube / seat post | 15-20% | Teardrop foil profile; integrated seat post with D-shape or aero mast; leading edge aligned with down tube wake | 5-12% | Seat post adjustability limitation; weight +30-50 g |
| Fork legs | 12-18% | Wing-shaped legs with 12-16:1 chord-to-thickness ratio; scalloped dropout area | 8-15% | Brake vibration (disc brake models less affected); steering stiffness |
| Top tube | 8-12% | Kamm-tail or flattened oval; tapering toward seat tube | 3-8% | Frame stiffness reduction if excessively thin |
| Chain stays / seat stays | 6-10% | Shaped flat sections; asymmetric chain stay (drive side) | 3-6% | Power transfer stiffness; heel clearance |
| Head tube / junction | 5-8% | Integrated headset; smooth transition to top tube and down tube junction; no protruding cables | 2-5% | Headset bearing standards complexity; steering cable routing complexity |
| Cable routing | 3-5% | Fully internal routing through handlebar, stem, and frame; hydraulic hoses for disc brakes | 2-4% | Maintenance difficulty; bleeding complexity for hydraulic systems |
From Wind Tunnel Data to Frame Design
The wind tunnel data informs specific carbon fiber layup and geometry decisions. Key aerodynamic design features of modern carbon racing frames derived from tunnel testing include:
- Truncated airfoil profiles (Kamm tails): A full airfoil shape optimized for low-drag at typical yaw angles would require a chord length of 120-150 mm on the down tube — excessively thick for a bicycle frame. The Kamm-tail approach uses the leading 60-70% of the airfoil and truncates the rear section, creating a blunt trailing edge. This achieves 85-92% of the drag reduction of a full airfoil with 40-50% less chord length. CFD-guided tunnel testing fine-tunes the truncation point for the specific yaw angle distribution expected in racing.
- Yaw-angle-specific optimization: Since real racing involves a distribution of yaw angles (typically Gaussian with μ = 3-5° and σ = 4-6° for a flat time trial), optimization targets a weighted-average CdA rather than the 0° yaw value alone. This has led to designs with asymmetric airfoil sections that perform better at small positive yaw angles (the most common condition from a left-to-right crosswind component on out-and-back courses).
- Wake management: The interaction of frame components — particularly the down tube wake impinging on the seat tube and the fork wake on the down tube — creates complex interference drag. Modern designs use CFD-guided spacing and alignment to minimize wake interference. For example, the down tube trailing edge is aligned with the leading edge of the seat tube within a tolerance of ±2 mm in the X-axis (longitudinal) to ensure the down tube wake wraps around the seat tube rather than creating a separate separation region.
- Surface finish effects: The carbon fiber mold surface finish directly affects the boundary layer state. A mold surface roughness (Ra) below 0.2 µm maintains laminar flow over the leading 40-60% of the airfoil section, delaying transition to turbulent flow and reducing skin friction drag by 8-12% compared to a rough mold surface (Ra > 1.0 µm). Tunnel tests show that clear-coated frames (Ra 0.1-0.3 µm) have measurably lower drag than painted frames (Ra 0.5-1.5 µm) — a difference of 2-4 g of drag at 45 km/h.
Case Study: Wind Tunnel Development of a UCI-Approved Time Trial Frame
A major bicycle manufacturer developed a new time trial frame using a 14-month aerodynamic development cycle comprising three CFD iterations (total 2,800 CPU-hours) and 120 hours of wind tunnel testing across five prototype iterations. Key results from the development program:
- Starting point: Previous generation time trial frame CdA (system) = 0.218 m² at 0° yaw
- Final design: CdA (system) = 0.197 m² at 0° yaw — a 9.6% reduction in system drag
- Frame-only drag reduction: 12.8% reduction in frame CdA (the frame's share of total system drag decreased from 12.5% to 10.8%)
- Weight impact: Frame weight increased by 85 g (from 1,150 g to 1,235 g for a size M frame) — a 7.4% weight penalty for a 12.8% aerodynamic gain
- Crosswind stability: Side force coefficient at 10° yaw increased by 15% — requiring steering geometry adjustments (increased trail from 58 mm to 62 mm) to maintain handling stability
- Real-world performance: A rider producing 320 watts for a 40 km time trial on the new frame would save approximately 45-55 seconds compared to the previous generation — a 1.9-2.3% time saving
Cost Analysis: Aerodynamic Development Program
| Development Stage | Cost Range (USD) | Duration | Deliverable |
|---|---|---|---|
| CFD simulation (3 iterations) | $80,000-$150,000 | 4-8 weeks | Directional drag ranking; pressure coefficient maps; vortex visualization |
| Prototype tooling (frameset) | $40,000-$100,000 | 6-10 weeks | 5-8 prototype frames in 3-4 sizes |
| Wind tunnel testing (120 hours) | $120,000-$360,000 | 6-12 weeks (5-8 tunnel sessions) | CdA values at all yaw angles; rider position optimization; component interaction data |
| Structural validation | $30,000-$60,000 | 4-6 weeks | Fatigue testing (ISO 4210); stiffness and compliance measurement |
| Total development program | $270,000-$670,000 | 12-18 months | Production-ready aerodynamic frame design |
For comparison, an incremental aerodynamic improvement (e.g., updating an existing frame with a new down tube and fork) can be achieved with 1 CFD iteration and 20-40 tunnel hours at a cost of $60,000-$180,000 over 8-14 weeks. The performance gain is proportionally smaller — typically 3-6% system drag reduction versus 8-12% for a ground-up design.
Frequently Asked Questions
Q: How much real-world performance difference does a wind-tunnel-optimized carbon frame make compared to a standard aero frame?
A: The difference between a wind-tunnel-developed frame and a "stylized aero" frame (designed by aesthetic intuition without CFD or tunnel validation) is typically 4-8% in frame drag, translating to 2-4% in total system CdA. At 45 km/h for a 40 km time trial, this is 15-35 seconds. The gap has narrowed as all major brands now use tunnel testing — the difference between the best and average tunnel-tested frame is now 1-3% in system CdA (8-15 seconds over 40 km). For comparison, the difference between a standard round-tube frame and a modern aero frame is 12-18% in system CdA — approximately 60-90 seconds over 40 km at 45 km/h. The increasing homogeneity of aero frame performance means that rider position optimization (which can be worth 3-8% in CdA) is now the larger variable.
Q: How does carbon fiber's formability specifically benefit aerodynamic frame design versus aluminum or titanium?
A: The advantage of carbon fiber is threefold. First, complex airfoil shapes: a Kamm-tail down tube with an asymmetric leading edge, scalloped transitions at tube junctions, and an internal cable channel can be molded as a single monocoque piece in carbon fiber, whereas aluminum would require hydroforming (limited to simpler profiles, 2-3× higher tooling cost for equivalent complexity), and titanium would require welding multiple shaped tubes (weld joint distortion degrades aerodynamic accuracy). Second, integrated junction shaping: carbon fiber allows seamless transitions between the head tube, top tube, and down tube, and between the bottom bracket and chain stays, eliminating the turbulent wake generated by the sharp-edged lugs or welded joints of metal frames. Third, surface finish: carbon fiber molds can achieve an Ra of 0.05-0.15 µm, producing a frame surface that maintains laminar flow longer than the painted or anodized surfaces typical of metal frames. The combination of these three factors — complex geometry, integrated junctions, and smooth surfaces — enables carbon fiber to achieve approximately 8-15% lower frame drag than an equivalent geometry in aluminum and 12-20% lower than titanium (the latter primarily due to the weld-joint penalty).
Q: What is the relationship between frame stiffness and aerodynamic performance in carbon fiber frames?
A: This is a critical design trade-off. Aerodynamic optimization typically requires deeper tube sections (higher thickness-to-width ratio), which increase the moment of inertia of the tube cross-section. A Kamm-tail down tube with a 50 mm depth has approximately 2.5× the bending stiffness of a 28 mm round tube of the same wall thickness. However, the aerodynamic profile's narrower trailing edge means the structural cross-section is not fully utilized — the effective bending stiffness of a truncated airfoil is approximately 70-80% of an equivalent rectangular section of the same depth. The net effect: a well-designed aero frame achieves equivalent or higher stiffness-to-weight ratio than a round-tube frame, despite the weight penalty of the larger section. The directional stiffness (head tube lateral and bottom bracket torsional) should be verified to exceed ISO 4210 minimums by a minimum of 20% for racing use. The carbon fiber layup schedule must balance: (1) high-modulus fibers (M40X or M60J) in the 0° direction on the compression side of the top tube and down tube for bending stiffness; (2) ±45° plies on the inner surface for torsional stiffness at the bottom bracket; and (3) ±30° plies at tube junctions for localized reinforcement against stress concentration.
Q: How does the UCI's frame shape regulation affect aerodynamic design?
A: The Union Cycliste Internationale (UCI) imposes two key restrictions on frame aerodynamics. First, the 3:1 ratio rule: any tube cross-section must have a maximum length-to-width ratio of 3:1. This prevents extreme airfoil shapes that would create excessive fork-in-front-of-wheel effects. For a 50 mm deep down tube, the maximum width is 16.7 mm — which constrains the airfoil's thickness distribution and limits the maximum achievable lift-to-drag ratio. Second, the frame envelope rule: all frame components must fit within a template envelope defined by the UCI. This limits the depth of the down tube (max 80 mm at the head tube junction, tapering to 50 mm at the bottom bracket), the height of the seat tube offset, and the geometry of the fork. The practical effect: UCI-legal frames achieve approximately 80-85% of the theoretical aerodynamic potential of an unrestricted design. For non-UCI events (triathlon, time trials not sanctioned by UCI, track cycling pursuit events), frame designs can be more aggressive, using deeper sections (up to 70 mm down tubes) and more extreme foil shapes. Brands such as Canyon and Cervélo maintain separate "UCI legal" and "triathlon" frame versions of the same design lineage.
Q: What is the minimum investment required for a bicycle brand to develop a competitive aerodynamic carbon frame?
A: The minimum investment for a competitive aerodynamic carbon racing frame — one within 2-3% of the best available frame in system CdA — is approximately $400,000-$800,000 for a full development program (CFD + prototype tooling + tunnel testing + structural validation). For brands that lack internal aerodynamic engineering capability, an alternative model is to partner with an aerodynamic consulting firm (e.g., Aerocoach, Drag2Zero, TotalSim) and a carbon frame OEM manufacturer (e.g., Giant Manufacturing, Quest Composite, Pinta Composites). This reduces the required internal investment to approximately $150,000-$350,000 (consulting fees + OEM development charges + tunnel time) while accessing established manufacturing expertise. A lower-cost entry point ($50,000-$150,000) is available by using off-the-shelf aerodynamic tube profiles from carbon material suppliers (e.g., Toray's aero profile pultrusions) combined with standard junction molds — but this approach typically yields frames that are 4-7% higher in CdA than the best tunnel-optimized designs.
Conclusion
Wind tunnel testing remains the definitive method for optimizing carbon fiber racing bicycle frame aerodynamics, providing a 4-10% drag reduction advantage over non-tunnel-optimized designs. The development process — CFD simulation guiding prototype fabrication, validated by physical tunnel testing, with iterative refinement — requires an investment of $300,000-$700,000 over 12-18 months for a ground-up design. Key aerodynamic parameters for B2B buyers evaluating carbon racing frames include: weighted-average CdA across the yaw angle distribution (not just 0° yaw), the boundary layer state maintained by mold surface finish, wake management between frame components as validated by CFD, and UCI compliance versus unrestricted triathlon configuration. As aero frame performance converges across the major brands (the gap between the best and average tunnel-tested frames is now 1-3% in system CdA), the competitive differentiator is increasingly the integration of rider position optimization with frame aerodynamics — a system-level approach that recognizes the rider and frame as a coupled aerodynamic system.
Part of topic
Related Articles
- Carbon Fiber Mooring for Floating Offshore Wind: Fatigue and Corrosion in Deep Water
- Carbon Fiber Bicycle Frame Optimization: Layup Design and Manufacturing for Competitive Racing
- Carbon Fiber CFRP Retrofit for Infrastructure: Bridge and Building Seismic Strengthening
- Carbon Fiber Medical Imaging Equipment: Lightweight Gantry and Couch Structures for MRI/CT
- Carbon Fiber EV Battery Enclosures: Crash Safety and Electromagnetic Shielding Design
- Carbon Fiber Structures for Low-Altitude Economy: UAV Airframes and eVTOL Components
Interested in Our Products?
Contact our team for competitive pricing and technical specifications.
Get a QuoteRelated Products
Carbon fiber standard plate-3k stripe
Lightweight, ultra-rigid standard sheets for drone fuselages, robot housings, facades and structural applications.
Carbon Fiber Plate — 3K Twill T700 1.5mm
Thin 1.5mm carbon fiber plate with 3K twill weave surface. Lightweight and stiff, commonly used for covers, panels, drone bodies, and applications requiring a premium aesthetic appearance.
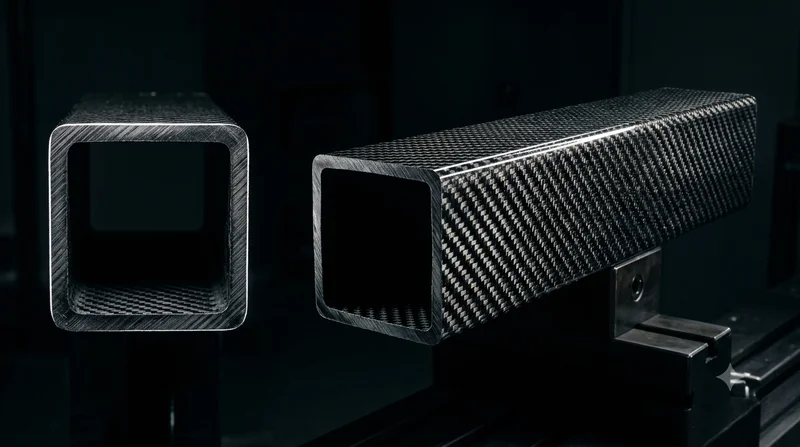
Square Carbon Fiber Tube — 3K Twill T700
Square cross-section carbon fiber tube manufactured with 3K twill weave for torsional strength. Preferred for structural frames, trusses, and support columns where rectangular geometry offers design flexibility.
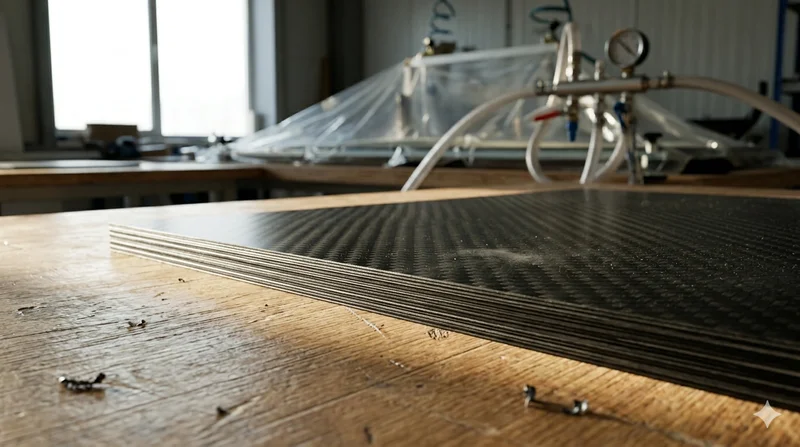
Carbon Fiber Plate — 3K Twill T700 3.0mm
Medium-thickness 3.0mm carbon fiber plate offering significantly higher load capacity while maintaining attractive 3K twill finish. Suitable for structural brackets, reinforcement plates, and load-bearing panels.
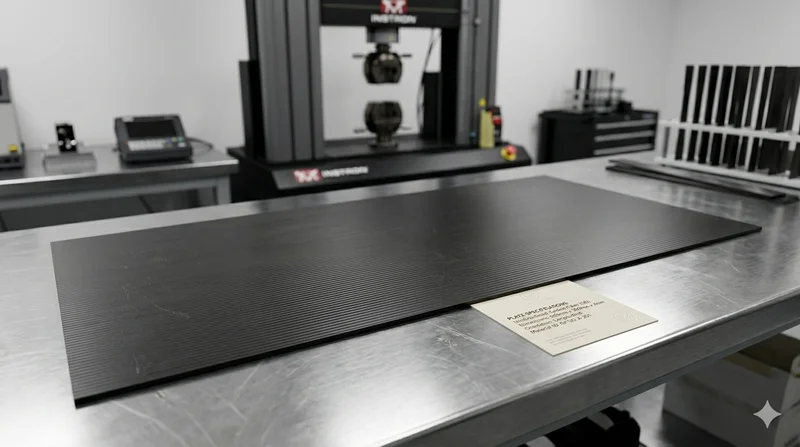
Carbon Fiber Plate — UD Unidirectional T700
Unidirectional carbon fiber plate with all fibers oriented in a single direction for maximum strength along the fiber axis. Essential for structural reinforcements, splints, and applications where load direction is predictable.