A technical comparison of CO2 emissions across PAN-based carbon fiber production pathways — standard industrial furnaces, renewable-energy-powered lines, lignin precursor routes, and microwave-assisted stabilization — with cradle-to-gate LCA data.
Introduction: The Carbon Cost of Carbon Fiber
Carbon fiber is prized for its lightweight strength in aerospace, automotive, renewable energy, and sporting goods — enabling significant operational weight savings that reduce fuel consumption and CO2 emissions during a product's use phase. However, the paradox is well-known among industry professionals: the manufacturing process for carbon fiber itself is energy-intensive and generates substantial CO2 emissions, raising legitimate questions about the net environmental benefit of carbon fiber adoption. Understanding the true carbon footprint of different carbon fiber production pathways is essential for OEMs and supply chain managers who are increasingly required to report product-level emissions under frameworks such as the EU Carbon Border Adjustment Mechanism (CBAM), Scope 3 reporting requirements of the Science Based Targets initiative (SBTi), and customer-specific sustainability mandates.
This article presents a cradle-to-gate lifecycle assessment (LCA) comparison of the four primary carbon fiber production methods in commercial use or advanced development today: (1) standard industrial PAN-based production using conventionally heated furnaces and grid electricity, (2) PAN-based production powered by renewable electricity and incorporating waste heat recovery, (3) lignin-based precursor routes with simplified stabilization, and (4) microwave-assisted stabilization and carbonization. CO2 emission intensity is reported per kilogram of carbon fiber produced (kg CO2e/kg CF), enabling direct comparison across methods and with other engineering materials.
Carbon Fiber Production: Energy Flow and Emission Sources
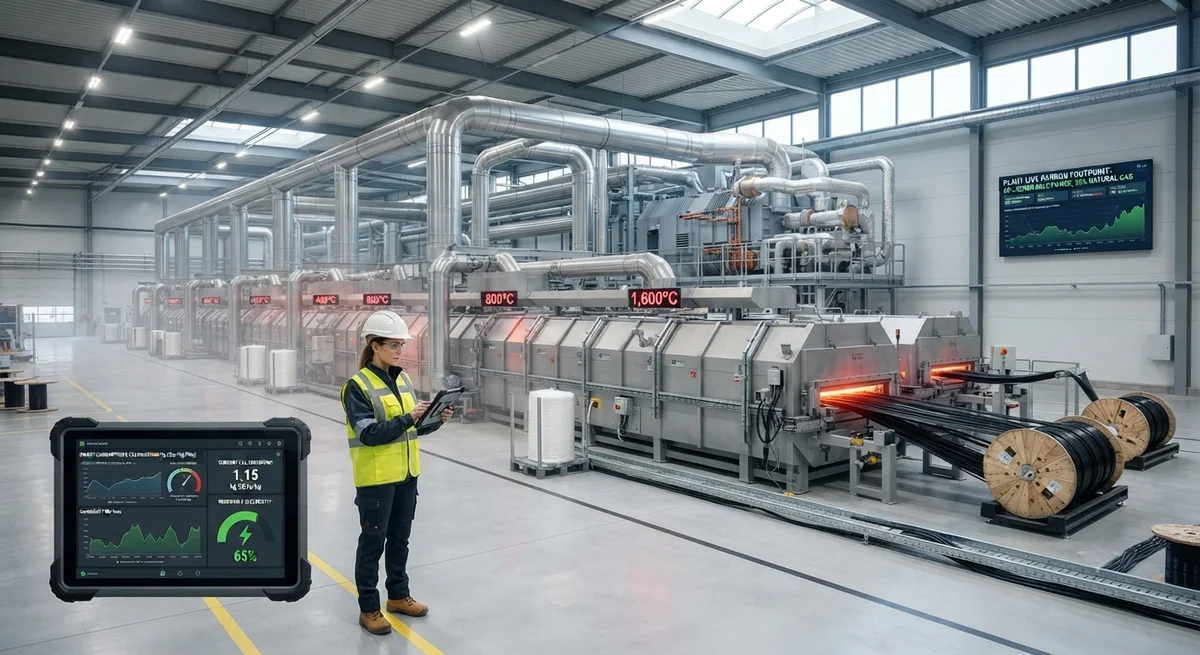
The production of PAN-based carbon fiber from precursor polymerization to finished fiber involves four major energy-consuming stages: precursor manufacture (PAN polymerization and spinning, approximately 15–20% of total energy), oxidative stabilization (200–300°C, 60–120 minutes, approximately 25–35% of total energy), carbonization (300–1,600°C in inert atmosphere, 3–10 minutes, approximately 35–45% of total energy), and surface treatment/sizing (5–10% of total energy). The overall energy consumption for standard industrial carbon fiber production ranges from 190 to 280 MJ per kilogram of fiber, depending on fiber modulus grade, tow size, and furnace efficiency. A standard modulus (230 GPa) 24K tow produced in a modern continuous line consumes approximately 210–240 MJ/kg CF.
Approximately 55–65% of this energy is provided as natural gas (for furnace heating), and 35–45% as electricity (for motor drives, control systems, and exhaust treatment). Under a typical global-average electricity mix (0.475 kg CO2/kWh, IEA 2025 data) and standard natural gas combustion (0.185 kg CO2/kWh thermal input), the cradle-to-gate CO2 emissions for standard modulus PAN-based carbon fiber are 28–35 kg CO2e per kg CF, with values clustering around 31 kg CO2e/kg for standard industrial production.
Comparative CO2 Emissions by Production Method
| Production Pathway | Energy (MJ/kg CF) | Grid CO2 (kg/kWh) | Cradle-to-Gate CO2e (kg/kg CF) | Status | TRL |
|---|---|---|---|---|---|
| Standard PAN (gas furnaces, grid) | 210–240 | 0.475 | 28–35 (mean: 31) | Full production | TRL 9 |
| PAN + renewable electricity (hydro/solar) | 210–240 | 0.020–0.050 | 14–18 (mean: 16) | Limited production | TRL 8–9 |
| PAN + renewable + waste heat recovery | 165–190 | 0.020–0.050 | 10–13 (mean: 11.5) | Pilot/demo | TRL 7–8 |
| Lignin precursor (renewable grid) | 130–170 | 0.020–0.050 | 6–10 (mean: 8) | R&D pilot | TRL 5–6 |
| Microwave-assisted stab. + carbonization | 140–180 | 0.475 | 18–24 (mean: 21) | R&D pilot | TRL 5–6 |
| Microwave-assisted + renewable electricity | 140–180 | 0.020–0.050 | 7–11 (mean: 9) | Laboratory | TRL 4–5 |
Stage-by-Stage Emission Breakdown
The emissions profile is not uniform across production stages. Using the standard PAN pathway (31 kg CO2e/kg CF) as the baseline, the stage-by-stage breakdown reveals where efficiency improvements yield the greatest impact:
- Precursor production (PAN polymerization + spinning): 6–8 kg CO2e/kg CF (19–26% of total). Emissions arise from acrylonitrile monomer production. Bio-based acrylonitrile from glycerol could reduce this by 20–30%.
- Oxidative stabilization (200–300°C, 60–120 min): 8–10 kg CO2e/kg CF (26–32% of total). Microwave-assisted stabilization reduces residence time by 40–60% and energy consumption by 35–50%.
- Carbonization (300–1,600°C, 3–10 min): 12–15 kg CO2e/kg CF (39–48% of total). The largest single emission source. Waste heat recovery reduces energy by 18–25%, saving 2.5–4 kg CO2e/kg CF.
- Surface treatment, sizing, and winding: 1–2 kg CO2e/kg CF (3–6% of total). Minimal contribution.
Comparison with Other Engineering Materials
To contextualize these figures, cradle-to-gate CO2 emissions for common structural materials are: steel (hot-rolled coil): 1.8–2.5 kg CO2e/kg; aluminum (primary, global avg.): 14–18 kg CO2e/kg; aluminum (recycled): 0.5–1.5 kg CO2e/kg; magnesium (primary): 18–22 kg CO2e/kg; glass fiber (E-glass): 1.5–2.5 kg CO2e/kg. Carbon fiber at 31 kg CO2e/kg is clearly the most carbon-intensive material per kilogram. However, because carbon fiber components are typically 50–70% lighter than steel equivalents and 30–50% lighter than aluminum, the use-phase CO2 savings often outweigh the manufacturing penalty.
For an aerospace structural component with a 20-year service life, replacing an aluminum component (15 kg) with a carbon fiber component (7.5 kg, 50% weight saving) on a single-aisle aircraft flying 3,500 hours per year produces approximately 87 tonnes of CO2 saving over the component's life. The manufacturing CO2 penalty is actually lower for carbon fiber on a per-component basis. The use-phase savings yield a carbon payback period of less than 6 months for aerospace applications.
Lignin-Based Precursors: The Low-Carbon Frontier
Lignin — a complex organic polymer abundant in plant cell walls and produced as a byproduct of paper pulping — represents the most promising route to low-carbon carbon fiber. Unlike PAN, which is derived from fossil-fuel-based acrylonitrile, lignin is a renewable biopolymer with biogenic carbon content of approximately 60–65% by weight. LCAs for lignin-based carbon fiber production show cradle-to-gate emissions of 6–10 kg CO2e/kg CF when processed with renewable electricity, approximately 70–80% lower than standard PAN-based production. Key challenges include mechanical property attainment (tensile strengths of 1.5–2.0 GPa and moduli of 150–200 GPa, below standard PAN fibers) and precursor spinability. In 2025, the first pilot-scale continuous lignin carbonization line commenced operation in Sweden, achieving 5 tonnes/year with tensile strength of 1.8 GPa and modulus of 185 GPa.
Microwave-Assisted Processing
Microwave heating offers a fundamentally different thermal mechanism compared to conventional convective furnaces. Instead of heating the fiber surface through hot gas convection, microwave energy couples directly with the carbon fiber (which acts as a lossy dielectric at microwave frequencies), heating the fiber volumetrically from within. This reduces thermal gradients within the fiber tow, enables faster heating rates (up to 100–200°C/min vs. 5–15°C/min conventional), and shortens both stabilization and carbonization times by 40–60%. Pilot demonstrations have shown equivalent stabilized fiber properties in 35–50 minutes versus 80–120 minutes conventional. Projected CO2 emissions for a fully microwave-assisted line on standard grid are 18–24 kg CO2e/kg CF, with potential to reach 7–11 kg CO2e/kg CF with renewable electricity.
Frequently Asked Questions
Q: What is the CO2 payback period for replacing aluminum with carbon fiber?
A: For aerospace applications, 3–6 months. For automotive, 1–3 years. For wind turbine blades, 4–8 months. In all cases, use-phase savings substantially exceed manufacturing emissions.
Q: How does carbon fiber compare to recycled carbon fiber for CO2?
A: Recycled carbon fiber (pyrolysis) produces 3–8 kg CO2e/kg rCF — 75–90% lower than virgin fiber. However, rCF has 10–30% lower tensile strength due to fiber length degradation during recycling.
Q: Can carbon fiber manufacturing achieve net-zero CO2 emissions?
A: Net-zero is achievable through: (a) 100% renewable electricity, (b) electrified furnaces, (c) biogenic precursors (lignin or bio-acrylonitrile), and (d) carbon capture on unavoidable process emissions. Toray targets 50% CO2 reduction by 2030 and net-zero by 2050.
Conclusion
The carbon footprint of carbon fiber manufacturing varies by a factor of 3–5x depending on production method, energy source, and efficiency measures. Standard PAN-based production on typical grid emits 28–35 kg CO2e/kg CF, while renewable-powered production with waste heat recovery reduces this to 10–13 kg CO2e/kg CF, and emerging lignin-precursor routes reach 6–10 kg CO2e/kg CF. For most engineering applications, the use-phase CO2 savings from weight reduction far exceed the manufacturing penalty, with carbon payback periods of 3–12 months in transportation applications. YongXian CarbonFiber is committed to supporting manufacturers in selecting low-carbon carbon fiber options.
Part of topic
Related Articles
- Recycled Carbon Fiber Market Forecast 2030: Technology Maturity and Commercialization Path
- South Korea Carbon Fiber Market 2026: Hydrogen Economy and Shipbuilding Innovation
- Wind Turbine Blade Leading Edge Protection 2026: Polyurethane, Tape, and Metallic Shield Solutions
- China Carbon Fiber Overcapacity 2026: Price War Impact and Industry Consolidation
- India Carbon Fiber Market 2026: Wind Energy, Aerospace, and Defense Expansion
- PAN Precursor Market 2026: Acrylonitrile Supply and Carbon Fiber Cost Structure
Interested in Our Products?
Contact our team for competitive pricing and technical specifications.
Get a QuoteRelated Products
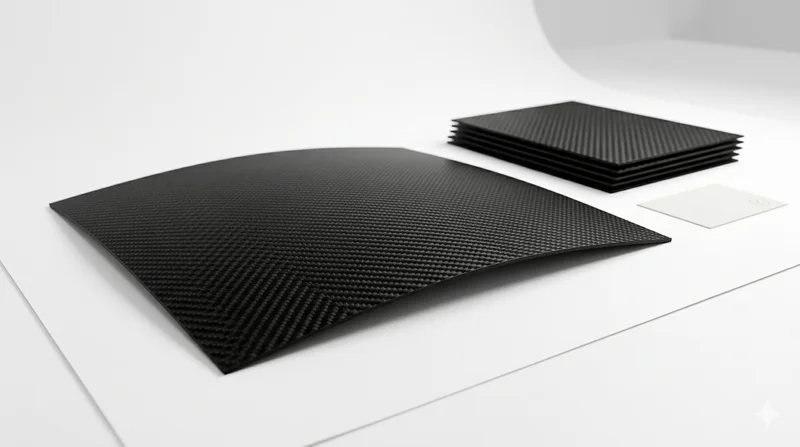
Carbon Fiber Plate — 3K Twill T700 1.5mm
Thin 1.5mm carbon fiber plate with 3K twill weave surface. Lightweight and stiff, commonly used for covers, panels, drone bodies, and applications requiring a premium aesthetic appearance.
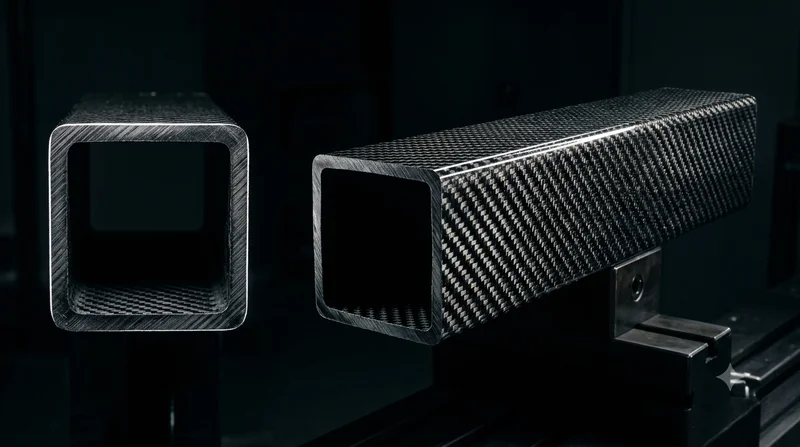
Square Carbon Fiber Tube — 3K Twill T700
Square cross-section carbon fiber tube manufactured with 3K twill weave for torsional strength. Preferred for structural frames, trusses, and support columns where rectangular geometry offers design flexibility.
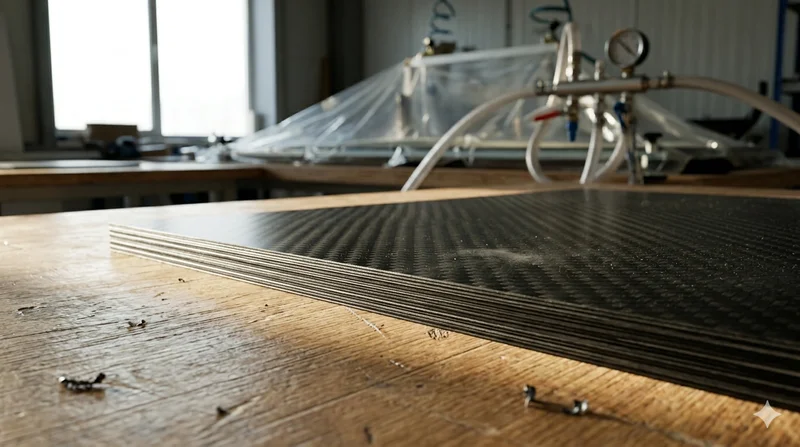
Carbon Fiber Plate — 3K Twill T700 3.0mm
Medium-thickness 3.0mm carbon fiber plate offering significantly higher load capacity while maintaining attractive 3K twill finish. Suitable for structural brackets, reinforcement plates, and load-bearing panels.
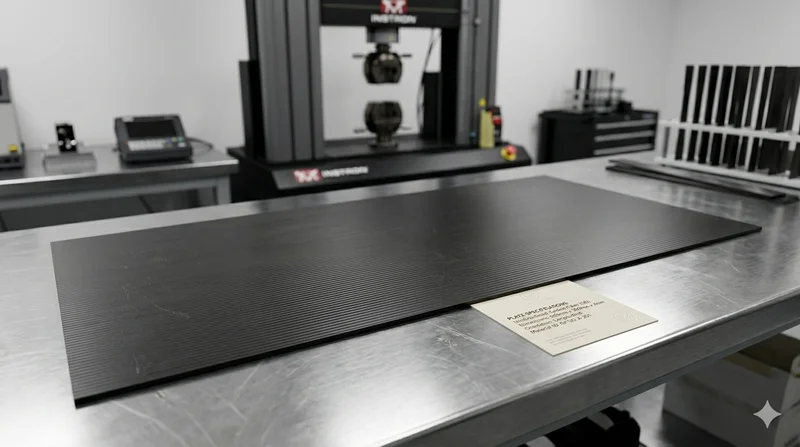
Carbon Fiber Plate — UD Unidirectional T700
Unidirectional carbon fiber plate with all fibers oriented in a single direction for maximum strength along the fiber axis. Essential for structural reinforcements, splints, and applications where load direction is predictable.
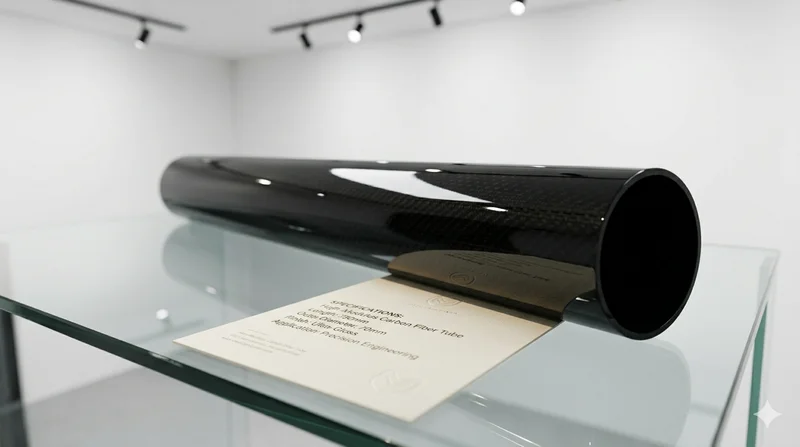
High Modulus Round Carbon Fiber Tube — M40
High modulus round tube manufactured with M40 grade fiber (tensile modulus 400 GPa). Designed for applications where maximum stiffness-to-weight ratio is critical, such as optical systems, precision machinery, and aerospace structures.