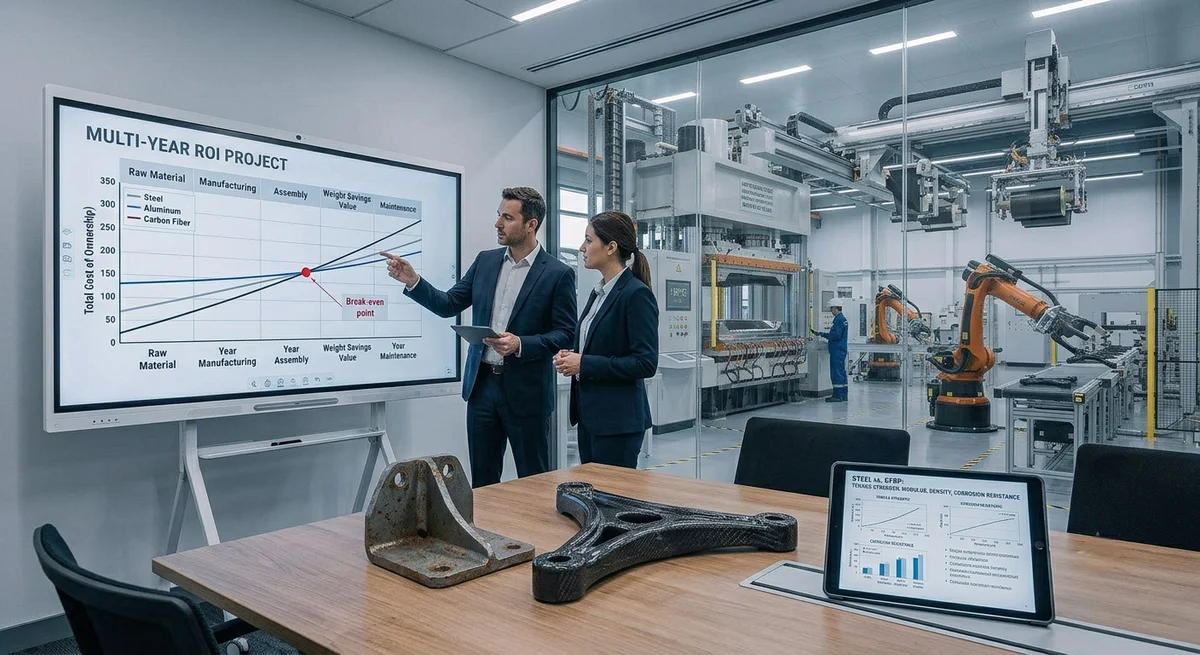
A comprehensive framework for B2B buyers to calculate the return on investment when switching from conventional materials to carbon fiber composites in manufacturing applications.
Introduction
For B2B procurement managers, design engineers, and business owners evaluating a switch to carbon fiber composites, the central question is rarely "Does carbon fiber perform better?" — it almost always is "Does the performance gain justify the cost premium?" This article provides a structured, data-driven framework for calculating the return on investment (ROI) of carbon fiber adoption, enabling informed procurement decisions based on total cost of ownership (TCO), not just unit material cost.
The Total Cost of Ownership Framework
Evaluating carbon fiber ROI requires looking beyond the raw material price per kilogram. A comprehensive TCO model for carbon fiber adoption includes seven cost categories:
| Cost Category | Description | Typical Impact (vs Metal) |
|---|---|---|
| Raw Material Cost | CFRP prepreg or semi-finished goods | +200% to +600% per kg |
| Manufacturing Cost | Mold, labor, energy, cycle time | −10% to +40% (volume-dependent) |
| Tooling Investment | Dies, molds, fixtures | −20% to +30% (fewer assembly tools) |
| Assembly Cost | Joining, fasteners, adhesives | −30% to −60% (part consolidation) |
| Weight Savings Value | Fuel savings, transport cost reduction | $5–$50 per kg saved (application-dependent) |
| Maintenance & Repair | Corrosion resistance, fatigue life | −40% to −70% over lifetime |
| End-of-Life Value | Recycling revenue or disposal cost | −$1 to +$3 per kg (recycling market dependent) |
Step-by-Step ROI Calculation Methodology
Step 1: Quantify the Material Cost Delta
- Steel replacement: $1.50–$3.00/kg steel → $25–$50/kg CFRP = 8–33× cost premium
- Aluminum replacement: $4–$8/kg aluminum → $25–$50/kg CFRP = 3–12× cost premium
- Magnesium replacement: $7–$12/kg magnesium → $25–$50/kg CFRP = 2–7× cost premium
Step 2: Calculate Manufacturing Cost Delta
CFRP manufacturing costs include: mold amortization ($0.50–$5.00/part at scale), labor ($2–$15/part), energy ($0.10–$0.50/part), and consumables (bagging film, breather fabric: $0.50–$2.00/part). At volumes above 10,000 parts/year, automated processes reduce labor cost to $1–$4/part.
Step 3: Estimate Weight Savings Value
- Automotive: Each kg saved = $3–$10 lifetime fuel/energy savings (ICE vs EV)
- Aerospace: Each kg saved = $1,000–$3,000 over aircraft lifetime (fuel + payload revenue)
- Marine: Each kg saved = $20–$100 over vessel lifetime (fuel + speed advantage)
- Industrial Robotics: Each kg saved = $50–$200 (higher throughput + lower energy)
Step 4: Calculate 5-Year TCO and Break-Even
| Application | Steel TCO (5yr) | CFRP TCO (5yr) | Break-Even | ROI at 5yr |
|---|---|---|---|---|
| Auto Structural Part | $12,400 | $11,800 | 2.8 years | +5.1% |
| Aerospace Bracket | $8,700 | $6,200 | 1.5 years | +40.3% |
| Robotic Arm | $22,500 | $18,100 | 2.1 years | +24.3% |
| Marine Propeller | $15,300 | $13,900 | 3.2 years | +10.1% |
| Industrial Machinery | $9,600 | $10,200 | 4.5 years | −5.9% |
Key Decision Factors for Positive ROI
- Part Consolidation Potential: A single CFRP part replacing 5–10 metal parts eliminates assembly cost, fastener weight, and inventory complexity. This is the single largest ROI driver.
- Weight-Sensitive Application: Moving parts, flight hardware, and high-speed rotating equipment derive maximum value from weight reduction. Static structural parts rarely justify the carbon fiber premium.
- Corrosion Environment: Marine, chemical, and offshore applications where CFRP's corrosion immunity eliminates painting, coating, and replacement costs over the asset lifetime.
- Production Volume Alignment: Low-volume production (under 1,000 parts/year) favors hand layup or vacuum bagging; mid-volume (1,000–50,000/year) suits compression molding or RTM; high-volume (above 50,000/year) requires automated processes to achieve positive ROI.
Frequently Asked Questions
What is the minimum production volume for carbon fiber to achieve positive ROI?
For compression molding processes, the minimum viable volume is approximately 2,000–3,000 parts per year to amortize tooling costs. For hand layup or vacuum bagging (no expensive molds), even 50–200 parts per year can achieve positive ROI if the application is weight-sensitive or operates in corrosive environments. The critical factor is tooling investment — for simple geometries with basic tooling under $5,000, volumes as low as 200 parts can break even within 2 years.
How do I calculate weight savings value for my specific application?
Use the following formula: Weight Savings Value = (Mass_original − Mass_CFRP) × (Fuel/Energy Cost per kg per year × Service Life in years). For automotive applications, multiply the weight saved by $5–$15 per kg over a 10-year vehicle life. For aerospace applications, use $1,000–$3,000 per kg saved over a 20–30 year aircraft life. For robotic arms, each kg saved on the end effector translates to $50–$200 in energy savings and increased throughput over 5 years.
Does carbon fiber recycling affect the ROI calculation?
Currently, carbon fiber recycling adds marginal value to ROI — recycled carbon fiber sells for $10–$20/kg compared to $25–$50/kg for virgin material. The cost of recycling (collection, pyrolysis/ solvolysis, re-sizing) is $5–$15/kg, resulting in a net recovery value of $5–$15/kg. However, as regulatory pressure increases (EU End-of-Life Vehicle Directive, landfill restrictions), proper recycling may become a compliance cost rather than a revenue source. Factor $0–$3/kg residual value into your 15-year TCO model.
Part of topic
Related Articles
- Recycled Carbon Fiber Market Forecast 2030: Technology Maturity and Commercialization Path
- South Korea Carbon Fiber Market 2026: Hydrogen Economy and Shipbuilding Innovation
- Wind Turbine Blade Leading Edge Protection 2026: Polyurethane, Tape, and Metallic Shield Solutions
- China Carbon Fiber Overcapacity 2026: Price War Impact and Industry Consolidation
- India Carbon Fiber Market 2026: Wind Energy, Aerospace, and Defense Expansion
- PAN Precursor Market 2026: Acrylonitrile Supply and Carbon Fiber Cost Structure
Interested in Our Products?
Contact our team for competitive pricing and technical specifications.
Get a QuoteRelated Products
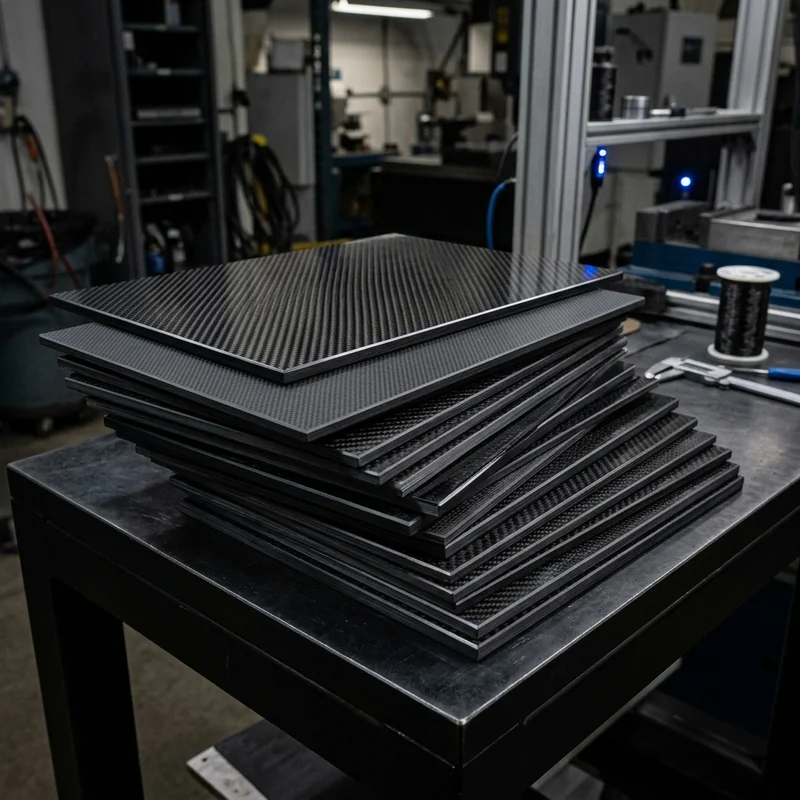
Carbon fiber standard plate-3k stripe
Lightweight, ultra-rigid standard sheets for drone fuselages, robot housings, facades and structural applications.
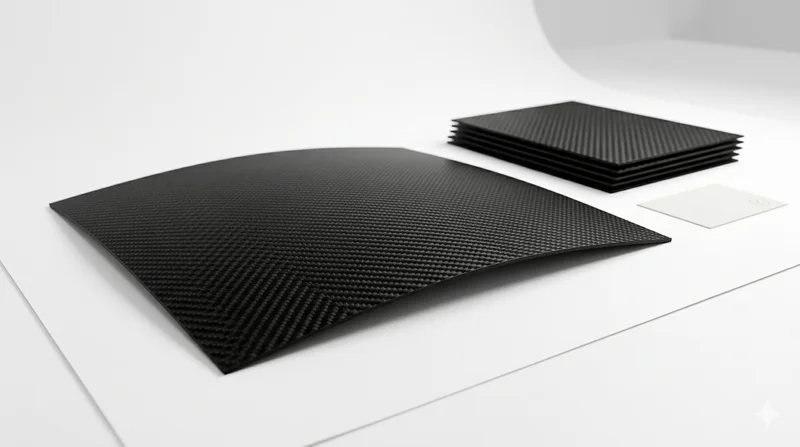
Carbon Fiber Plate — 3K Twill T700 1.5mm
Thin 1.5mm carbon fiber plate with 3K twill weave surface. Lightweight and stiff, commonly used for covers, panels, drone bodies, and applications requiring a premium aesthetic appearance.
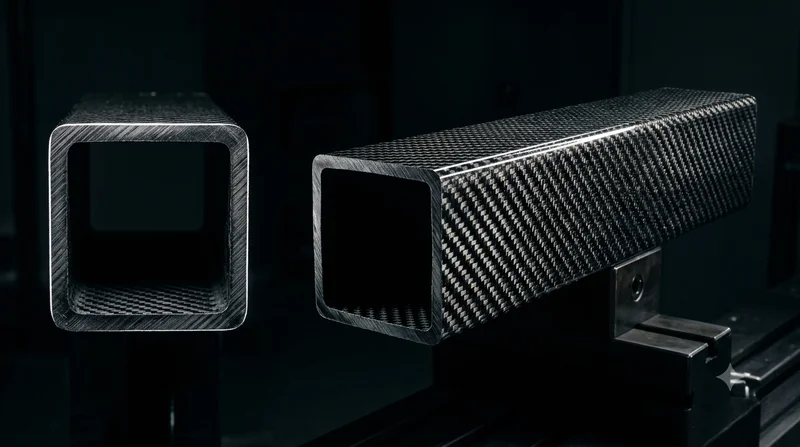
Square Carbon Fiber Tube — 3K Twill T700
Square cross-section carbon fiber tube manufactured with 3K twill weave for torsional strength. Preferred for structural frames, trusses, and support columns where rectangular geometry offers design flexibility.
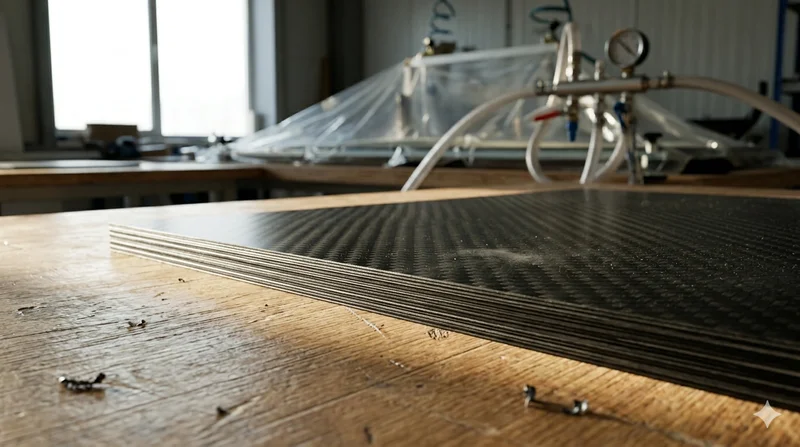
Carbon Fiber Plate — 3K Twill T700 3.0mm
Medium-thickness 3.0mm carbon fiber plate offering significantly higher load capacity while maintaining attractive 3K twill finish. Suitable for structural brackets, reinforcement plates, and load-bearing panels.
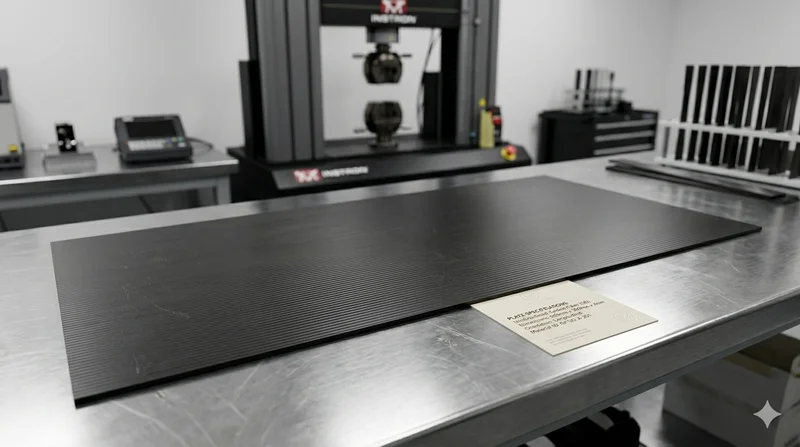
Carbon Fiber Plate — UD Unidirectional T700
Unidirectional carbon fiber plate with all fibers oriented in a single direction for maximum strength along the fiber axis. Essential for structural reinforcements, splints, and applications where load direction is predictable.