A wind turbine blade is a 60-to-120-meter structure that cannot be inspected continuously. Between scheduled inspections, damage can initiate and grow silently inside the laminate: matrix cracks in the webs, fiber breaks under the spar cap, disbonding along the trailing edge. Acoustic e
Introduction
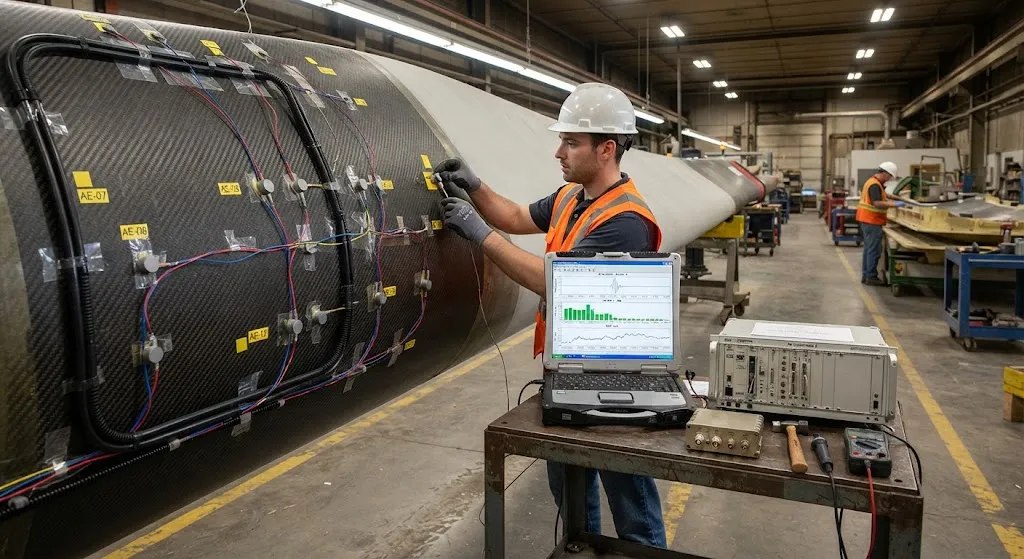
A wind turbine blade is a 60-to-120-meter structure that cannot be inspected continuously. Between scheduled inspections, damage can initiate and grow silently inside the laminate: matrix cracks in the webs, fiber breaks under the spar cap, disbonding along the trailing edge. Acoustic emission monitoring closes that blind window. AE technology mounts small piezoelectric sensors on the blade surface that detect the elastic stress waves released when a microcrack forms or a fiber snaps, converting each damage event into an electrical signal that can be counted, located, and classified in real time.
AE is the only widely deployed blade monitoring technique that detects damage during the event itself rather than its consequence. Load and strain monitoring see the structure respond; AE sees the structure fail. This makes it the natural complement to fiber-optic structural health monitoring (SHM) systems, and increasingly the evidence layer behind predictive maintenance contracts for onshore and offshore fleets. This article covers the sensor network design, the signal features that distinguish damage types, and the operational data workflows that turn AE hits into maintenance decisions.
How an AE Sensor Network Is Built
An AE monitoring system for a blade consists of sensors, preamplifiers, a data acquisition unit, and the localization and classification software that interprets the signals. Sensors are resonant piezoelectric transducers, typically tuned to frequencies between 60 kHz and 400 kHz for composite structures, bonded to the blade surface or embedded in the laminate during manufacture. The number of sensors depends on the monitored zone and the required localization accuracy:
| Sensor Configuration | Typical Sensor Count | Coverage and Localization Accuracy |
|---|---|---|
| Single-sensor trend monitoring | 1-2 per blade | Detects events, no location; global damage trend only |
| Zone monitoring | 4-6 per blade | Identifies region (root, mid-span, tip); coarse location |
| Full localization array | 8-16 per blade | Source triangulation within tens of centimeters |
For a production system, sensors are placed at the highest-strain regions: the root transition zone, the spar cap surface near maximum bending moment, the web-to-skin bond lines, and the trailing edge, where disbonding most often initiates. Each sensor is connected through a preamplifier with a band-pass filter that rejects the low-frequency background noise of the turbine, typically below 20 kHz, and data is recorded continuously or in triggered bursts when the AE hit rate exceeds a preset threshold.
Damage Signatures: Which Signal Means Which Failure
The value of AE lies in its ability to distinguish failure modes before they become visible. When a stress wave reaches a sensor, the acquisition system extracts standard signal descriptors: amplitude, duration, counts (ring-down oscillations), rise time, and absolute energy. The relationship between these descriptors and the physical damage mechanism has been mapped extensively in composite testing:
- Matrix cracking releases low-amplitude, short-duration hits (typically 40-60 dB) with a low energy release per event.
- Fiber-matrix debonding produces mid-range amplitudes (60-80 dB) with intermediate duration.
- Fiber breakage is the highest-energy event (80-100 dB), with long duration and high counts, and is usually a precursor to catastrophic failure.
- Delamination generates sustained bursts of moderate amplitude with high hit density concentrated in one zone.
Classification algorithms separate these mechanisms using the amplitude distribution, the frequency content of the waveform, and the rise-time-to-amplitude ratio. Machine-learning classifiers trained on laboratory coupon tests — where the failure mode is confirmed by microscopy after the test — can then label in-service AE data automatically, allowing an operator to distinguish a harmless microcrack population from a growing delamination that requires intervention.
From Hits to Health Indices
Raw AE counts are noisy, so monitoring systems aggregate the data into health indices that track damage progression over time. The most widely used is cumulative AE energy, plotted against load cycles or operational time. In a healthy blade, cumulative energy rises slowly and evenly as benign microcracking saturates; when a crack begins to grow stably, the curve steepens; and as damage transitions to unstable propagation, energy accelerates exponentially — the classic signal to take the turbine offline.
Additional indices improve discrimination. The Felicity ratio, the ratio of load at which emission resumes to the previous maximum load, drops below 1.0 when significant damage exists, distinguishing a damaged laminate from an undamaged one that shows no emission until the previous peak load is exceeded. Hit-rate statistics and AE source location clustering identify whether emission is diffuse or concentrated in a growing hot spot. Trend analysis of these indices across a fleet provides the data basis for shifting maintenance from fixed-interval inspections to condition-based maintenance, where work is scheduled by measured damage state rather than calendar date.
AE in a Full SHM and Maintenance Strategy
Acoustic emission does not replace other monitoring layers; it strengthens them. Strain-based systems measure how the blade deforms, fiber-optic systems measure strain fields continuously along the blade, and AE measures the damage events themselves. In a complete structural health monitoring architecture, AE provides the alert layer — a sudden burst of high-energy hits triggers inspection — while strain data validates load assumptions and ultrasonic or thermographic checks confirm the exact defect when the turbine is serviced.
The economic case is strongest for offshore turbines, where access cost is measured in tens of thousands of euros per visit and weather windows are scarce. A monitoring system that reliably detects spar-cap fiber breaks or trailing-edge disbonding at an early stage allows the operator to bundle repairs, plan lifting vessels months ahead, and avoid the catastrophic failure mode in which a blade sheds a section. For the growing fleet of carbon-fiber-spar blades — where failure is brittle and gives little visual warning — AE is increasingly specified as standard equipment rather than an optional add-on.
Frequently Asked Questions
How many AE sensors does one blade need?
For fleet-level health monitoring, 4-6 sensors per blade give zone-level coverage of the highest-strain regions: root transition, spar cap, web bond lines, and trailing edge. If precise source localization is required — for example to guide a repair team to a specific delamination — 8-16 sensors per blade form a triangulation array with location accuracy of tens of centimeters. The trade-off is cost and data volume: localization arrays multiply channels and require more sophisticated acquisition hardware, so most production installations start with zone monitoring and add density only where damage history demands it.
What is the difference between acoustic emission and fiber-optic strain monitoring?
Fiber-optic strain monitoring measures the deformation field continuously along the blade: it tells you how much the structure is bending and where strain is elevated. Acoustic emission detects the elastic waves generated by damage events: it tells you when and where a crack formed, grew, or a fiber broke. Strain monitoring sees the structure respond to load; AE sees the structure fail. The two are complementary — strain data identifies overstressed zones and validates load models, while AE data provides early warning of active damage and classifies its severity. A robust blade health system typically combines both rather than choosing between them.
Can AE distinguish real damage from environmental noise like rain or lightning?
Yes, through frequency filtering and signal classification. Rain impact produces broadband, low-energy bursts distributed across the surface, while lightning generates a single massive broadband transient. Real composite damage events are concentrated at the sensor resonant band (60-400 kHz) with characteristic amplitude and rise-time distributions. Preamplifier band-pass filters reject turbine mechanical noise below 20 kHz, and classification algorithms trained on the waveform signature of rain, hail, and electrical transients reject these sources before they enter the damage trend data. The residual challenge is sustained broadband noise such as heavy rain, which monitoring software handles by gating: data from periods of high environmental noise is flagged and excluded from cumulative damage indices.
How does AE monitoring change the maintenance schedule?
It shifts the maintenance basis from fixed-interval to condition-based. Instead of inspecting every blade at a calendar interval — often 1-2 years offshore — operators use AE health indices to rank blades by measured damage state. Blades with stable, benign microcrack populations stay in service and can have their inspection interval extended; blades showing accelerating cumulative AE energy or concentrated high-energy hits are prioritized for inspection and repair. In practice this reduces unnecessary inspections, concentrates resources on genuinely at-risk blades, and reduces the probability of an unexpected in-service failure that requires emergency vessel mobilization.
Conclusion
Acoustic emission monitoring turns a wind blade from a periodically inspected structure into a continuously listened-to one. A well-designed sensor network on the root, spar cap, and trailing edge captures matrix cracking, delamination, and fiber breakage as distinct signal signatures; cumulative energy and Felicity-ratio indices convert those hits into actionable health trends; and fleet-level data enables maintenance programs that react to measured damage rather than calendar dates. For the brittle carbon-fiber spar caps of modern long blades, that early warning is not a convenience — it is the difference between a planned repair and a catastrophic failure.
For blade manufacturers and turbine operators sourcing the material that makes modern blades stiff and light, the quality of the carbon fiber itself is the foundation of reliable structural behavior and predictable AE signatures. Explore our carbon fiber sheet, fabric, and unidirectional laminate range for spar caps and structural applications, or contact our engineering team for material data sheets and batch qualification support.
Part of topic
Related Articles
- Filament Wound Epoxy Tubing: Selection Guide for Industrial and Aerospace Applications
- Filament Wound Epoxy Tubes Advantages: Over Metal and Pultruded Alternatives
- Carbon Fiber Tube Strength: Analysis Methods and Design Allowables
- Filament Wound Epoxy Tubes: Mechanical Properties and Material Data Sheets
- Carbon Fiber Drone Blades and Propellers: Stiffness, Balance and Noise Reduction
- Fiberglass Filament Wound Tubes: Cost-Effective Alternative to Carbon Fiber
Interested in Our Products?
Contact our team for competitive pricing and technical specifications.
Get a QuoteRelated Products
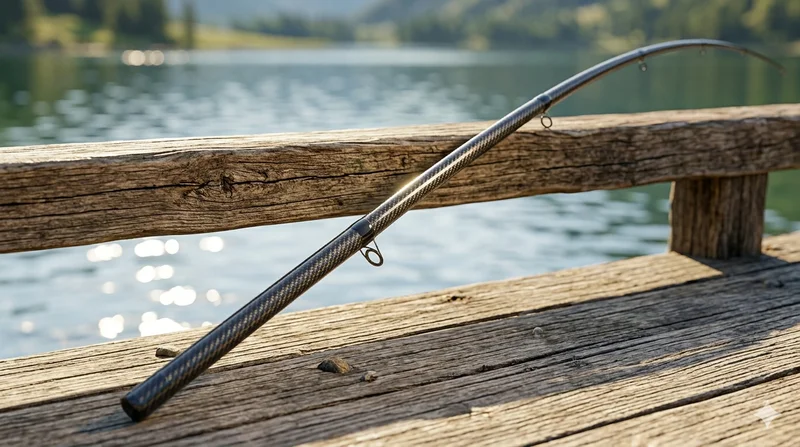
Carbon Fiber Fishing Rod Blank
High-quality carbon fiber fishing rod blank manufactured from multiple grades of Toray carbon fiber cloth. Available in a wide range of lengths, powers, and actions for freshwater and saltwater applications. Suitable for OEM rod building.
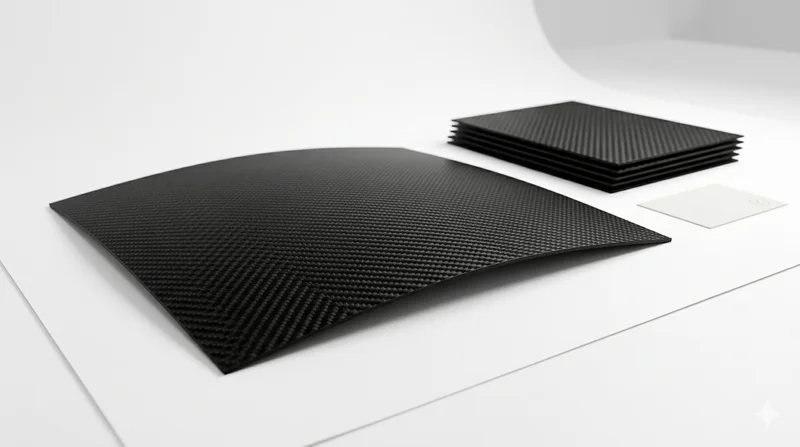
Carbon Fiber Plate — 3K Twill T700 1.5mm
Thin 1.5mm carbon fiber plate with 3K twill weave surface. Lightweight and stiff, commonly used for covers, panels, drone bodies, and applications requiring a premium aesthetic appearance.
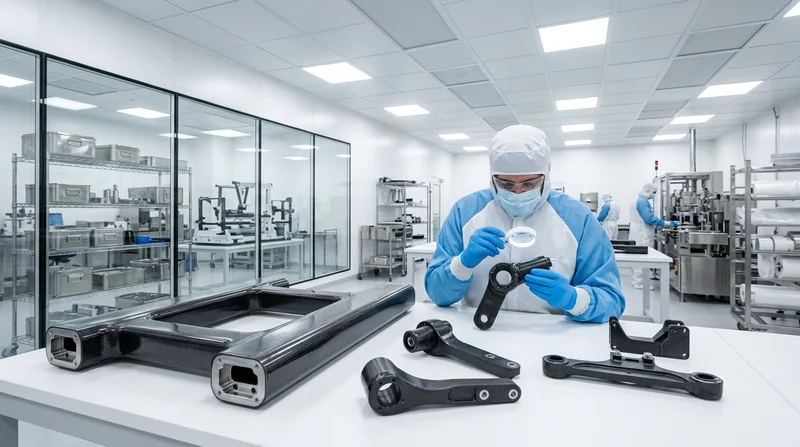
Custom Carbon Fiber Medical Device Components
Medical-grade carbon fiber components manufactured for imaging equipment, surgical instruments, and patient support systems. Carbon fiber's radiolucency (X-ray transparency) and high strength-to-weight ratio make it ideal for CT scanner beds, wheelchair frames, surgical robot arms, and MRI-compatible accessories. Biocompatible resin systems available.
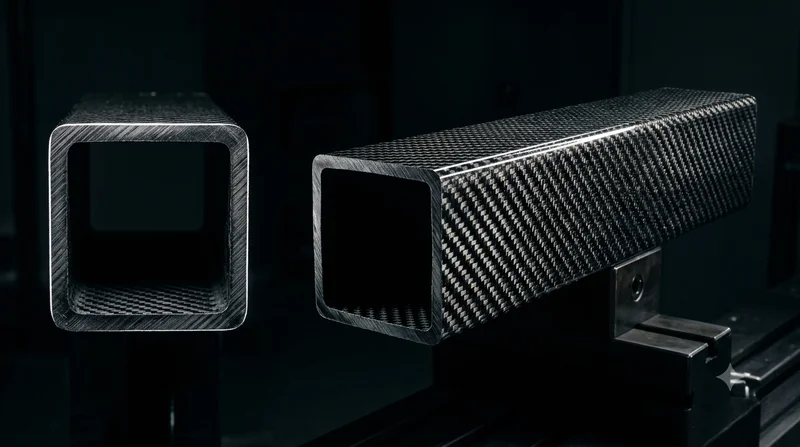
Square Carbon Fiber Tube — 3K Twill T700
Square cross-section carbon fiber tube manufactured with 3K twill weave for torsional strength. Preferred for structural frames, trusses, and support columns where rectangular geometry offers design flexibility.
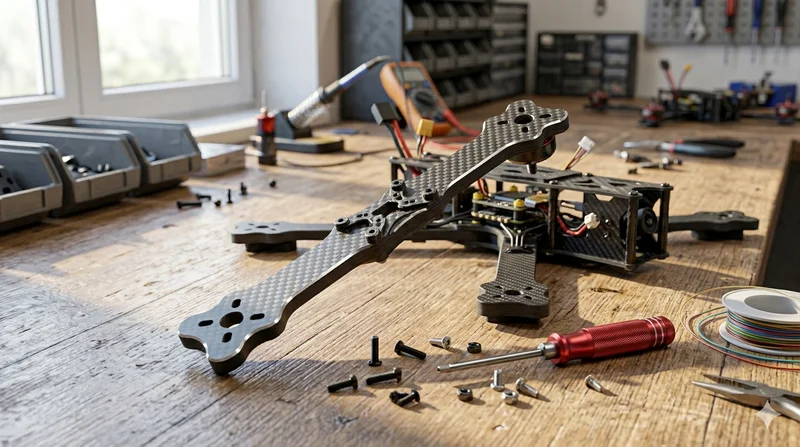
Carbon Fiber Drone Arm
Precision-molded carbon fiber drone arm combining unidirectional fiber for stiffness and woven layers for torsional strength. Designed for FPV, photography, and industrial drone platforms. Each arm is CNC-machined to exact specifications.