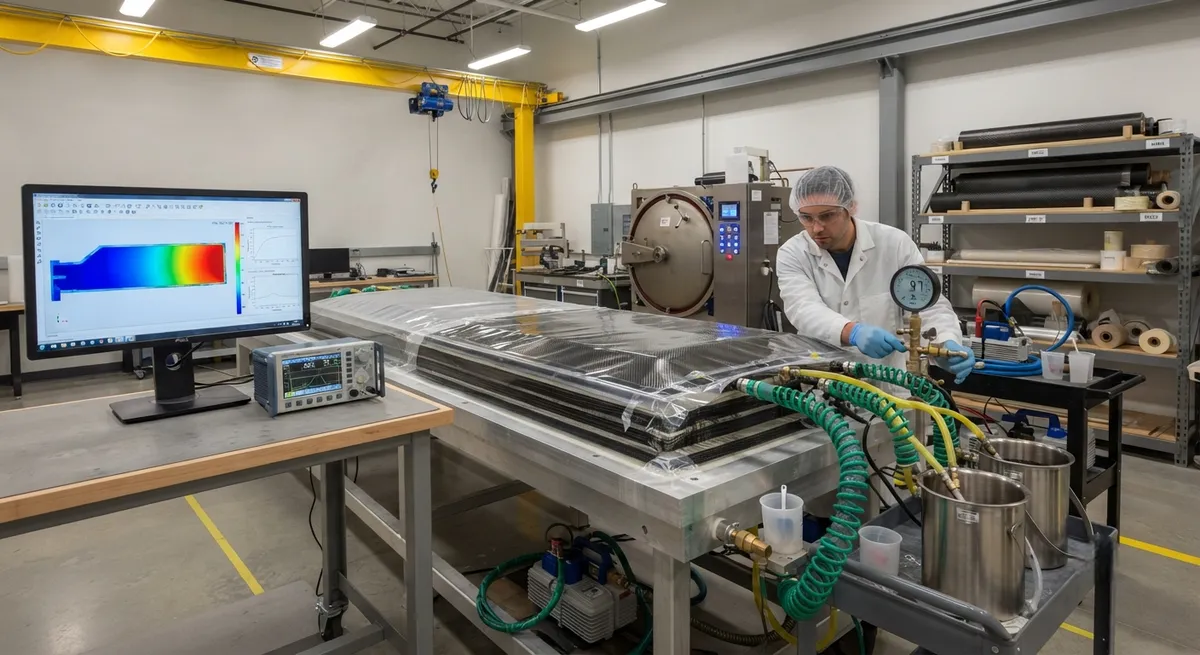
Computational simulation of vacuum-assisted resin transfer molding for large CFRP components. Flow-front modeling with PAM-RTM and RTM-Worx, permeability characterization, draping simulation, and race-tracking mitigation strategies for wind turbine blades and marine structures.
The Challenge of Large-Scale VARTM Manufacturing
Vacuum-assisted resin transfer molding (VARTM) is the dominant manufacturing process for large carbon fiber reinforced polymer components — wind turbine blades exceeding 80 meters, marine hull sections, and structural aerospace tooling. Unlike autoclave processing, VARTM relies on a vacuum-driven pressure differential (typically 95-98 kPa) to infuse resin through dry fiber preforms. At these scales, even minor variations in fiber permeability, preform compaction, or resin viscosity can produce costly defects: dry spots, porosity, and resin-rich zones that compromise mechanical performance.
The challenge is compounded by part geometries that involve complex curvature, thickness transitions, and sandwich core inserts. A typical 60-meter wind turbine blade requires approximately 2.5-3.5 metric tons of dry carbon fiber fabric arranged in 40-60 discrete layup plies with varying fiber orientations. Without accurate process simulation, manufacturers face trial-and-error cycles costing $50,000-150,000 per iteration in material waste alone.
Governing Physics of VARTM Flow Modeling
Resin flow through fibrous porous media follows Darcy's law, which in the anisotropic case is described by the permeability tensor K:
Darcy velocity: u = —(K/μ) · ∇P
where μ is resin viscosity (typically 100-800 mPa·s for epoxy systems at injection temperature) and ∇P is the pressure gradient. The in-plane permeability of typical biaxial and triaxial carbon fiber non-crimp fabrics ranges from 1×10⁻¹⁰ to 8×10⁻¹⁰ m² in the principal fiber direction (0°), and 0.3×10⁻¹⁰ to 2×10⁻¹⁰ m² in the transverse direction (90°). Through-thickness permeability is significantly lower, at 0.05×10⁻¹⁰ to 0.3×10⁻¹⁰ m², creating a two-dimensional flow front approximation valid for thin-shell geometries with aspect ratios exceeding 100:1.
Simulation Software Comparison
| Software | Flow Solver | Permeability Input | Draping | Thermal Coupling | License Cost (annual) |
|---|---|---|---|---|---|
| PAM-RTM (ESI) | Finite element + control volume | 3D tensor K | Integrated | Yes (exothermic cure) | $35,000-55,000 |
| RTM-Worx (Polyworx) | Finite difference + VOF | 2D/3D K-field | External (CATIA) | Yes | $25,000-40,000 |
| ANSYS Fluent + Porous Media | Finite volume | Custom UDF | Not integrated | Yes (full CFD) | $40,000-70,000 |
| OpenFOAM (open-source) | Finite volume + VOF | Custom UDF | Not integrated | Custom | $0 |
| LIMS (UC Davis) | Finite element + control volume | 2D/3D K | Not integrated | Limited | $2,500 (academic) |
For large-scale industrial VARTM simulation, PAM-RTM and RTM-Worx dominate due to their dedicated preform permeability libraries, draping modules, and validated race-tracking models. The choice between them often depends on existing CAD/CAM integration and whether cure kinetics coupling is required for the specific resin system.
Permeability Characterization and Preform Compaction
Accurate permeability input data is the single largest source of error in VARTM simulation. Manufacturers typically determine permeability tensor values through one of three methods:
- Bench-scale injection tests (100×100 mm to 300×300 mm): Unidirectional or radial flow experiments with a test fluid matching the production resin viscosity. Cost: $3,000-8,000 per fabric type including test panel fabrication and data reduction.
- Compaction-coupled permeability measurement: Load cells measure preform thickness under vacuum bag pressure (95-100 kPa) while permeability is simultaneously measured. This accounts for the 15-30% thickness reduction that occurs during vacuum application, which increases fiber volume fraction from 45% to 55-58% in typical NCF layups.
- Inverse parameter estimation: Flow-front positions from a simple injection test are matched in simulation by iteratively adjusting permeability until the modeled and experimental flow fronts converge within a 5% RMS error threshold.
Fiber volume fraction (Vf) is the dominant variable: a change from 50% to 58% Vf reduces in-plane permeability by approximately 40-60% due to the Carman-Kozeny relationship. Table 2 shows typical permeability values for common carbon fiber architectures at 55% Vf:
| Fabric Architecture | K11 (0° direction) ×10⁻¹⁰ m² | K22 (90° direction) ×10⁻¹⁰ m² | K33 (through-thickness) ×10⁻¹⁰ m² |
|---|---|---|---|
| Biaxial NCF (±45°) | 2.8-4.2 | 1.8-2.9 | 0.08-0.15 |
| Triaxial NCF (0°/+45°/-45°) | 3.5-5.5 | 0.8-1.6 | 0.06-0.12 |
| Unidirectional (0°) | 6.0-8.0 | 0.3-0.6 | 0.05-0.10 |
| Plain weave (3K, 200 g/m²) | 1.5-2.5 | 1.5-2.5 | 0.10-0.20 |
| Chopped mat (450 g/m²) | 4.5-7.0 | 4.0-6.5 | 0.50-1.00 |
Draping Simulation and Fiber Orientation
Draping simulation predicts how flat fabric deforms over a doubly curved mold surface. For large VARTM parts, accurate draping is critical because fiber reorientation changes the local permeability tensor, which in turn alters the resin flow path. The key outputs of a draping simulation are:
- Local fiber angle deviation from the intended orientation (shear angle, typically 0-30° for NCF fabrics before wrinkling)
- Thickness variation due to fabric compaction at curved regions (5-15% reduction in inner radius zones)
- Gap formation between adjacent fabric plies at double-curvature regions, which creates race-tracking channels
- In-plane shear stiffness and locking angle (the shear angle at which fabric wrinkling initiates, typically 25-45° for carbon NCF)
PAM-RTM's integrated draping module uses a kinematic mapping algorithm with an exponential relaxation model, achieving fiber angle prediction accuracy within ±3° compared to experimental photogrammetry on 2-meter-scale demonstrator parts. RTM-Worx relies on external draping from CATIA's Composite Part Design module, which uses a finite element-based approach with slightly higher accuracy (±1.5°) but requires a separate CATIA license.
Race-Tracking Prevention Strategies
Race-tracking — the preferential flow of resin along gaps between the preform edge and mold wall, around inserts, or along ply drop-off regions — is the most common cause of dry-spot defects in large VARTM parts. Race-tracking channels can be 0.5-3.0 mm in width, creating a permeability that is 100-1,000× higher than the fabric bulk permeability.
Simulation-based mitigation strategies include:
- Edge seal optimization: Modeling sealant tape placement (typically 3-6 mm wide) to block peripheral race-tracking. Simulation predicts the optimal sealant standoff distance (30-80 mm from the net trim line) based on preform thickness and resin gel time.
- Flow medium channel and runner layout: Distribution media (high-permeability polymeric mesh with K ≈ 1×10⁻⁸ m²) is modeled as a discrete permeable layer on the inlet surface. The optimal spacing between inlet runners — typically 100-400 mm — is determined by balancing fill time against resin waste in the distribution layer.
- Perimeter bleed-line vents: Vacuum vent placement is simulated to prevent air entrapment at last-to-fill zones. Advanced simulations model vent valve sequencing (closing vents sequentially as the flow front passes) to minimize resin bleed volume, targeting a bleed ratio of 5-10% of part weight.
- Insert and core race-tracking: Foam and balsa core inserts in sandwich constructions create preferential flow paths along the core/preform interface. Simulation of a 0.2-0.5 mm gap at this interface predicts fill-time reductions of 40-60% locally, requiring local tackification or adhesive film barriers.
Validation Case: 60-Meter Wind Turbine Blade Root
A major European blade manufacturer validated VARTM simulation against production data for a 60-meter turbine blade root section (3.2 m chord, 2.8 m wide, incorporating unidirectional and triaxial carbon fiber fabrics totaling 1,200 kg). The PAM-RTM simulation predicted a total fill time of 38 minutes, which matched the production fill time of 41 minutes (within 8% error). The simulation correctly identified a dry-spot risk zone at the trailing edge foam core insert, which was verified by ultrasonic C-scan of the first production part. Adding a spiral-wrapped vacuum vent at this location eliminated the defect in subsequent parts, reducing scrap rate from 12% to 1.5%.
FAQ
What is the minimum viable simulation accuracy for VARTM process design?
For production tooling qualification, a fill-time prediction within ±15% of the experimental value is considered acceptable for initial process design. For defect prediction (dry spots, porosity), flow-front shape correlation with an RMS error below 10% is required. These targets are achievable with well-characterized permeability data and proper boundary condition modeling.
How do you model race-tracking in simulation without knowing exact gap dimensions?
The standard approach is sensitivity analysis: simulate with three gap-size scenarios (0.2 mm, 0.5 mm, 1.0 mm) covering the manufacturing tolerance band. If the flow pattern is insensitive to gap size variation (< 10% fill-time change), race-tracking is not a risk. If the flow time varies by more than 30% across scenarios, the gap must be controlled with sealant tape or tackifier. An 0.5 mm gap simulation typically provides the best match to production data.
Can VARTM simulation handle non-isothermal resin injection with curing?
Yes — PAM-RTM and RTM-Worx both support coupled thermal-cure analysis. The resin viscosity is modeled as a function of both temperature and degree of cure using the Kamal-Sourour cure kinetics model. For large parts with long injection times (>30 minutes), this coupling is essential because the exothermic reaction can increase resin temperature by 15-40°C, reducing viscosity by 2-5× and potentially causing premature gelation in thin sections.
Part of topic
Related Articles
- Bio-Based Carbon Fiber Precursors: Lignin and Polyethylene for Low-Cost Production
- Large-Tow Carbon Fiber Cost Analysis: 48K vs 60K Price-Performance Comparison
- Carbon Fiber-Resin Interface Bonding: Surface Treatment and Coupling Agent Optimization
- Digital Twin for Carbon Fiber Manufacturing: Real-Time Process Monitoring and Defect Prevention
- Thermoplastic Carbon Fiber Welding for Automotive: Ultrasonic and Induction Welding Process Windows
- Large-Tow Carbon Fiber Wet Spinning: Process Optimization for 48K/60K Production Efficiency
Interested in Our Products?
Contact our team for competitive pricing and technical specifications.
Get a QuoteRelated Products
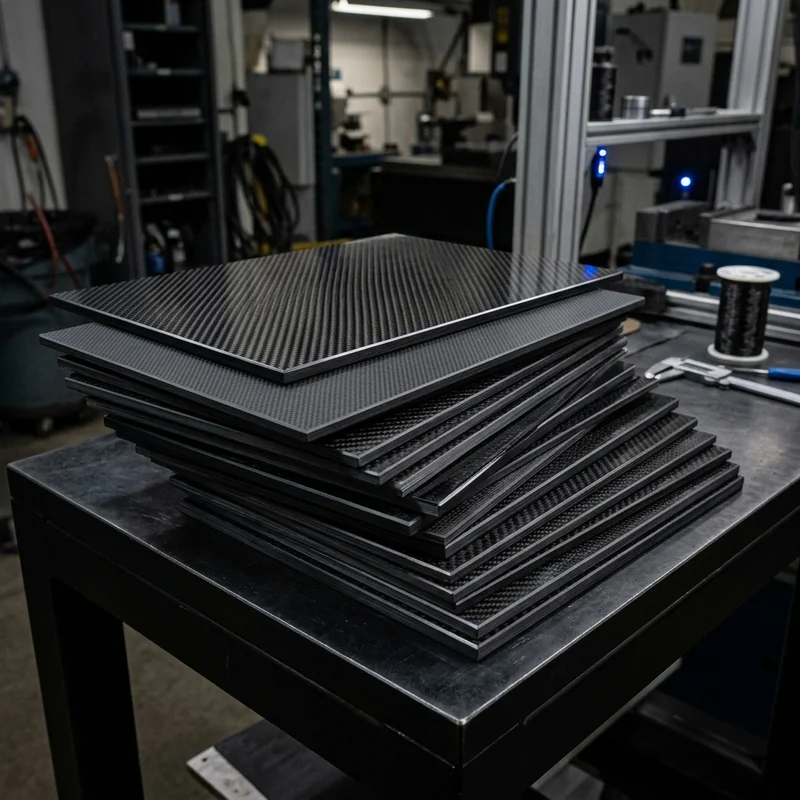
Carbon fiber standard plate-3k stripe
Lightweight, ultra-rigid standard sheets for drone fuselages, robot housings, facades and structural applications.
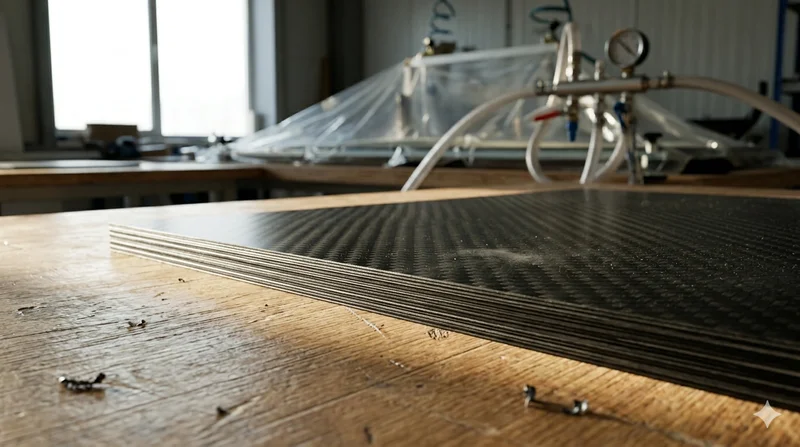
Carbon Fiber Plate — 3K Twill T700 3.0mm
Medium-thickness 3.0mm carbon fiber plate offering significantly higher load capacity while maintaining attractive 3K twill finish. Suitable for structural brackets, reinforcement plates, and load-bearing panels.
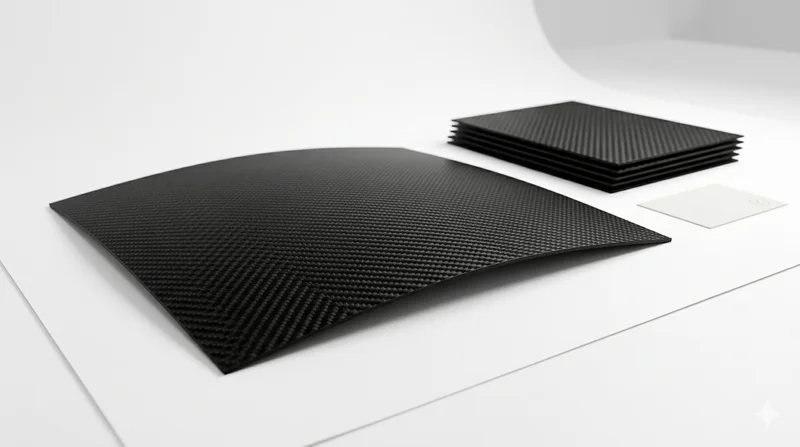
Carbon Fiber Plate — 3K Twill T700 1.5mm
Thin 1.5mm carbon fiber plate with 3K twill weave surface. Lightweight and stiff, commonly used for covers, panels, drone bodies, and applications requiring a premium aesthetic appearance.
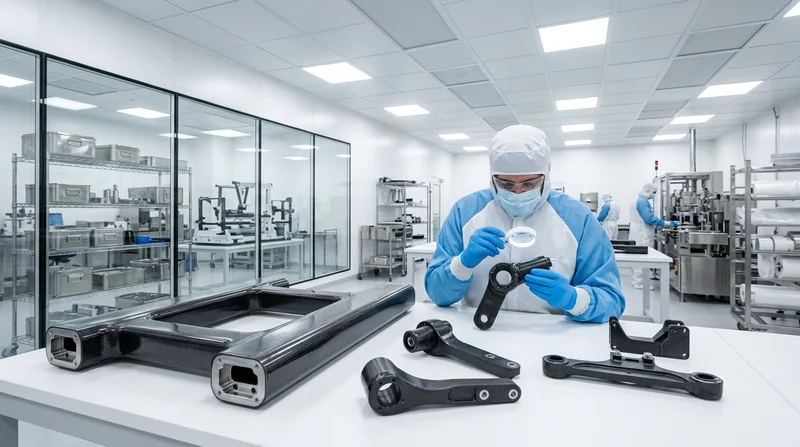
Custom Carbon Fiber Medical Device Components
Medical-grade carbon fiber components manufactured for imaging equipment, surgical instruments, and patient support systems. Carbon fiber's radiolucency (X-ray transparency) and high strength-to-weight ratio make it ideal for CT scanner beds, wheelchair frames, surgical robot arms, and MRI-compatible accessories. Biocompatible resin systems available.
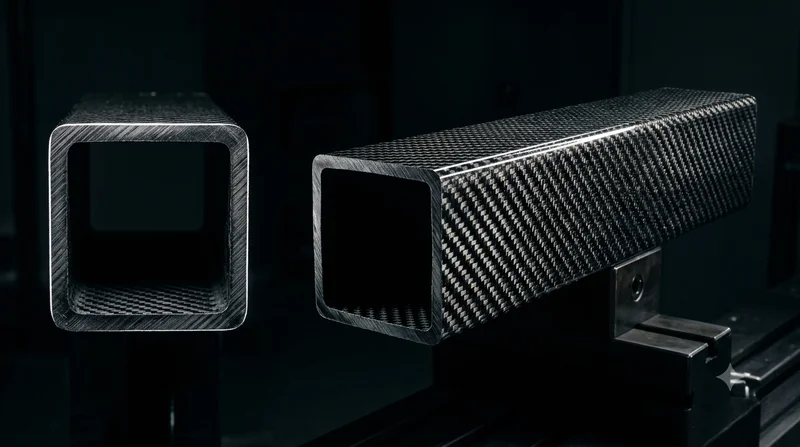
Square Carbon Fiber Tube — 3K Twill T700
Square cross-section carbon fiber tube manufactured with 3K twill weave for torsional strength. Preferred for structural frames, trusses, and support columns where rectangular geometry offers design flexibility.