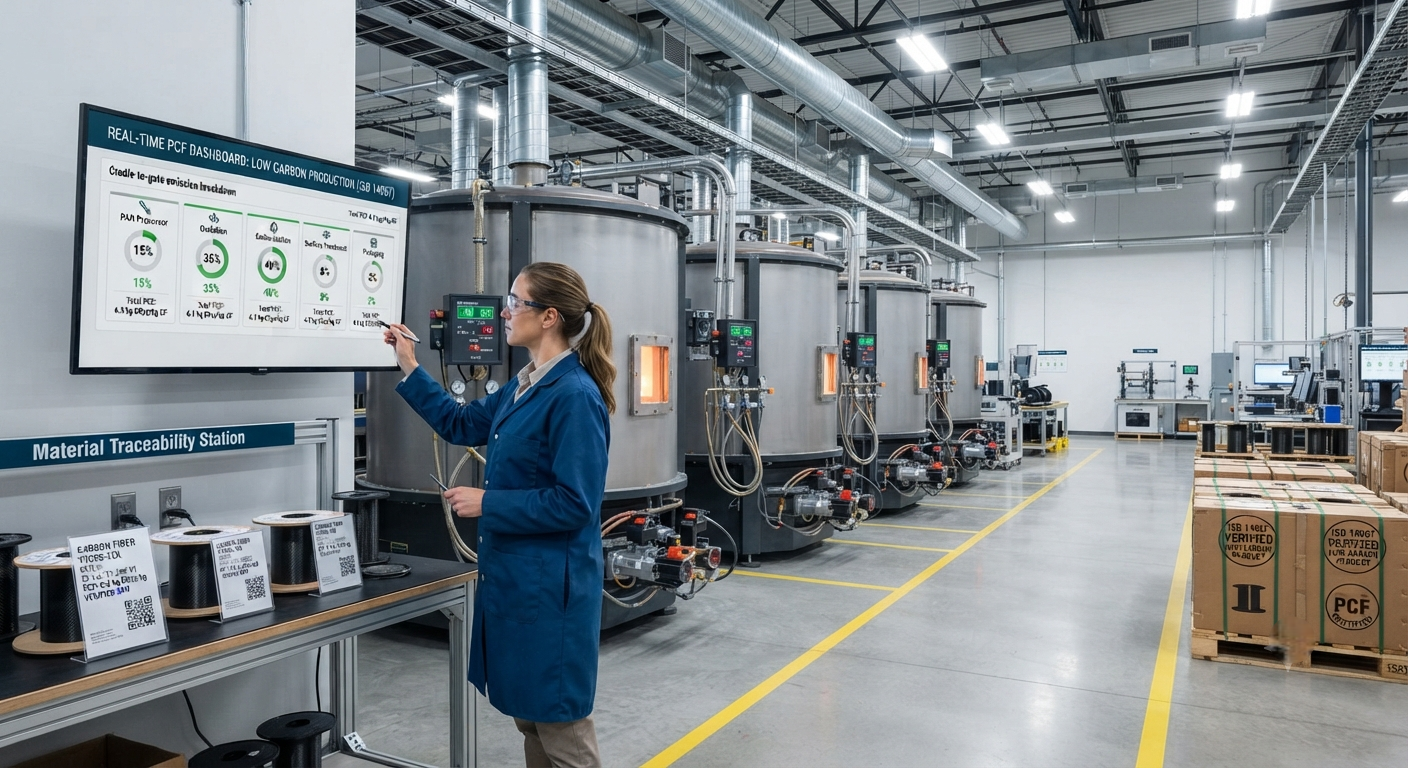
Comprehensive guide to product carbon footprint (PCF) reporting for carbon fiber manufacturers covering ISO 14067 methodology, GHG Protocol Scope 3 categories, lifecycle assessment (LCA) boundaries from PAN precursor to finished tow, and B2B compliance requirements for EU CBAM, automotive supply chain decarbonization, and net-zero aerospace procurement. Includes cradle-to-gate emission factor data, allocation methodology comparison, and a compliance roadmap for carbon fiber suppliers serving regulated markets.
The Regulatory Push for Carbon Transparency in Carbon Fiber Supply Chains
Carbon fiber manufacturers in international B2B markets face rapidly evolving requirements for product carbon footprint (PCF) disclosure. The European Union's Carbon Border Adjustment Mechanism (CBAM), effective January 2026, requires importers of carbon-intensive materials — including carbon fiber — to report and pay for embedded emissions. Automotive OEMs including BMW, Mercedes-Benz, and Volvo now mandate PCF declarations from carbon fiber composite suppliers as part of net-zero supply chain programs, while Airbus and Boeing have incorporated carbon disclosure scorecards into supplier rating systems. For a mid-size carbon fiber producer shipping 2,000–5,000 metric tons annually across multiple continents, the cost of non-compliance is severe: CBAM penalties beyond 2026, progressive exclusion from OEM qualified supplier lists, and margin erosion as buyers shift toward certified low-carbon sources.
ISO 14067: The Core Methodology for Carbon Fiber PCF
ISO 14067:2018 provides the internationally recognized framework for quantifying product carbon footprints. It builds upon ISO 14040/14044 lifecycle assessment principles with product-specific rules. For carbon fiber, five key methodological decisions are required:
- System boundary: Most B2B declarations use a cradle-to-gate boundary (raw material extraction through finished carbon fiber tow at the factory gate). The functional unit is defined as "1 kg of carbon fiber tow with specified tensile modulus and filament count." Cradle-to-grave boundaries are rare in upstream B2B reporting because downstream use phases vary enormously by customer application.
- Allocation methodology for co-products: PAN precursor oxidation produces carbon fiber as the primary product with several co-products including off-spec tow and waste heat. ISO 14067 permits mass allocation, economic allocation, or system expansion. The European Composites Industry Association recommends mass allocation for carbon fiber, as it avoids market price volatility in the allocation factor.
- Cut-off criteria: Processes contributing less than 1% of total mass or energy may be excluded if cumulative contribution does not exceed 5%. However, carbonization furnace energy input — typically natural gas at 8–15 MJ/kg — must always be included as it represents 30–50% of total cradle-to-gate emissions.
- Data quality: Site-specific primary data is required for all owned processes. Secondary data from Ecoinvent 3.9+ or GaBi databases is permitted for upstream materials with a maximum data age of five years.
GHG Protocol Scope 3 Emissions in the Carbon Fiber Supply Chain
The GHG Protocol Corporate Value Chain Standard categorizes indirect emissions across 15 categories. For carbon fiber manufacturers, the most material categories are:
| Scope 3 Category | Relevance to Carbon Fiber | Typical Share of Total Scope 3 |
|---|---|---|
| Cat. 1 — Purchased Goods & Services | PAN precursor, sizing chemicals, inert gases, graphite electrodes | 35–50% |
| Cat. 2 — Capital Goods | Carbonization furnace construction, oxidation oven infrastructure | 5–10% |
| Cat. 3 — Fuel & Energy-Related Activities | Natural gas for furnaces, purchased electricity for oxidation ovens | 10–15% |
| Cat. 4 — Upstream Transportation | Inbound logistics of PAN precursor from chemical plants | 8–12% |
| Cat. 9 — Downstream Transportation | Outbound shipping of carbon fiber bobbins to customers | 5–10% |
A full Scope 3 inventory for a typical 3,000-ton-per-annum plant reveals that Categories 1 and 3 account for 45–60% of total Scope 3 emissions. The dominant single factor is the PAN precursor: producing 1 kg of standard-grade PAN precursor emits approximately 5.2–6.8 kg CO₂e. Since roughly 2.0–2.2 kg of PAN precursor is required per kilogram of finished carbon fiber, precursor-related emissions alone contribute 10.4–15.0 kg CO₂e per kg of carbon fiber output.
Cradle-to-Gate Emission Factors for Carbon Fiber Production
Published lifecycle studies provide the following representative cradle-to-gate emission factors for standard-modulus carbon fiber (230 GPa):
| Production Stage | Process | Emission Factor (kg CO₂e/kg) | Share of Total |
|---|---|---|---|
| Raw material | PAN precursor | 10.4–15.0 | 40–50% |
| Stabilization | Oxidation ovens (200–300°C) | 2.1–3.5 | 8–12% |
| Carbonization | Furnaces (300–1,600°C), natural gas | 5.8–8.2 | 20–28% |
| Surface treatment | Electrolytic oxidation + sizing | 0.8–1.5 | 3–5% |
| Winding & packaging | Spool winding, QA, packaging | 0.3–0.6 | 1–2% |
| Utilities & overhead | HVAC, lighting, compressed air, waste management | 1.5–3.0 | 6–10% |
| Total cradle-to-gate | 20.9–31.8 | 100% |
Intermediate-modulus fibers (294–345 GPa) show 15–25% higher emissions. High-modulus fibers above 345 GPa requiring graphitization above 2,000°C can reach 35–45 kg CO₂e/kg. Carbon fiber composite fabrication adds another 8–18 kg CO₂e per kg of finished part depending on the process.
B2B Compliance: CBAM, Automotive, and Aerospace Frameworks
Three frameworks drive PCF reporting requirements. EU CBAM (effective January 2026) requires importers to purchase certificates corresponding to embedded emissions, verified by an accredited third party. For carbon fiber, CBAM default values are expected at approximately 35–40 kg CO₂e/kg — significantly above best-in-class production — creating strong incentive for actual PCF disclosure. Automotive decarbonization programs via CDP and AIAG require Tier 1 and 2 suppliers to submit ISO 14067-compliant PCF data through Catena-X. BMW Group has set a 2027 target of reducing carbon fiber-related Scope 3 emissions by 30% versus 2020. Aerospace net-zero procurement through the IAEG Common Carbon Reporting Framework requires suppliers to report cradle-to-gate PCF. Airbus mandates ≤ 25 kg CO₂e/kg for standard-modulus carbon fiber by 2028.
Practical Implementation
Implementing ISO 14067-compliant PCF reporting requires an initial investment of $40,000–$120,000 with ongoing annual costs of $5,000–$15,000. Key infrastructure includes process-level energy sub-metering ($15,000–$35,000 for a typical facility), mass balance tracking software integrated with ERP or MES systems, supplier-specific upstream data collection via EPD requests, and third-party verification by an accredited conformity assessment body at $8,000–$20,000 per year.
Frequently Asked Questions
What is the difference between ISO 14067 and the GHG Protocol for carbon fiber PCF?
ISO 14067 is a product-level standard focused on quantifying the carbon footprint of a single product (1 kg of carbon fiber tow), providing detailed methodological rules for system boundaries and allocation. The GHG Protocol Corporate Value Chain Standard addresses the organization-level inventory of all indirect emissions across 15 Scope 3 categories. Most regulatory programs require ISO 14067-compliant product-level calculations, while the GHG Protocol is better for corporate carbon accounting and target setting. Most carbon fiber suppliers maintain both frameworks, as data collected for ISO 14067 directly feeds into Scope 3 Category 1 reporting.
What is the typical carbon footprint of 1 kg of standard carbon fiber?
The cradle-to-gate carbon footprint of standard-modulus (230 GPa) carbon fiber ranges from 20.9 to 31.8 kg CO₂e per kg. The range reflects differences in PAN precursor source, grid carbon intensity, furnace efficiency, and process yield. Intermediate-modulus grades show 25–38 kg CO₂e/kg, while high-modulus grades can reach 35–45 kg CO₂e/kg. Although carbon fiber's production-phase emissions exceed those of aluminum (8–16 kg CO₂e/kg) and steel (1.5–2.5 kg CO₂e/kg), its weight advantage in structural applications reduces component lifecycle carbon footprint by 25–60% on a functional basis.
How can carbon fiber manufacturers reduce their PCF?
The most impactful strategies are: (1) Switching PAN precursor to bio-based acrylonitrile — reducing precursor emissions by 40–60% and total PCF by 16–25%. (2) Electrifying carbonization furnaces with renewable electricity — reducing total PCF by 20–30%. (3) Improving process yield from 45–50% to 55–60%. (4) Heat recovery from furnace exhaust to preheat oxidation oven air — reducing natural gas consumption by 12–18%. A combination of these strategies can reduce total cradle-to-gate PCF from approximately 26 kg CO₂e/kg to 14–16 kg CO₂e/kg within a 3–5 year investment cycle.
Part of topic
Related Articles
- Recycled Carbon Fiber Market Forecast 2030: Technology Maturity and Commercialization Path
- South Korea Carbon Fiber Market 2026: Hydrogen Economy and Shipbuilding Innovation
- Wind Turbine Blade Leading Edge Protection 2026: Polyurethane, Tape, and Metallic Shield Solutions
- China Carbon Fiber Overcapacity 2026: Price War Impact and Industry Consolidation
- India Carbon Fiber Market 2026: Wind Energy, Aerospace, and Defense Expansion
- PAN Precursor Market 2026: Acrylonitrile Supply and Carbon Fiber Cost Structure