A bonded carbon fiber assembly only earns its certificate after inspection proves that hidden delaminations, disbonds, and core crush never happened. Ultrasonic testing and radiography were the standard tools for decades, both point-by-point and slow. Two full-field optical methods now
Introduction
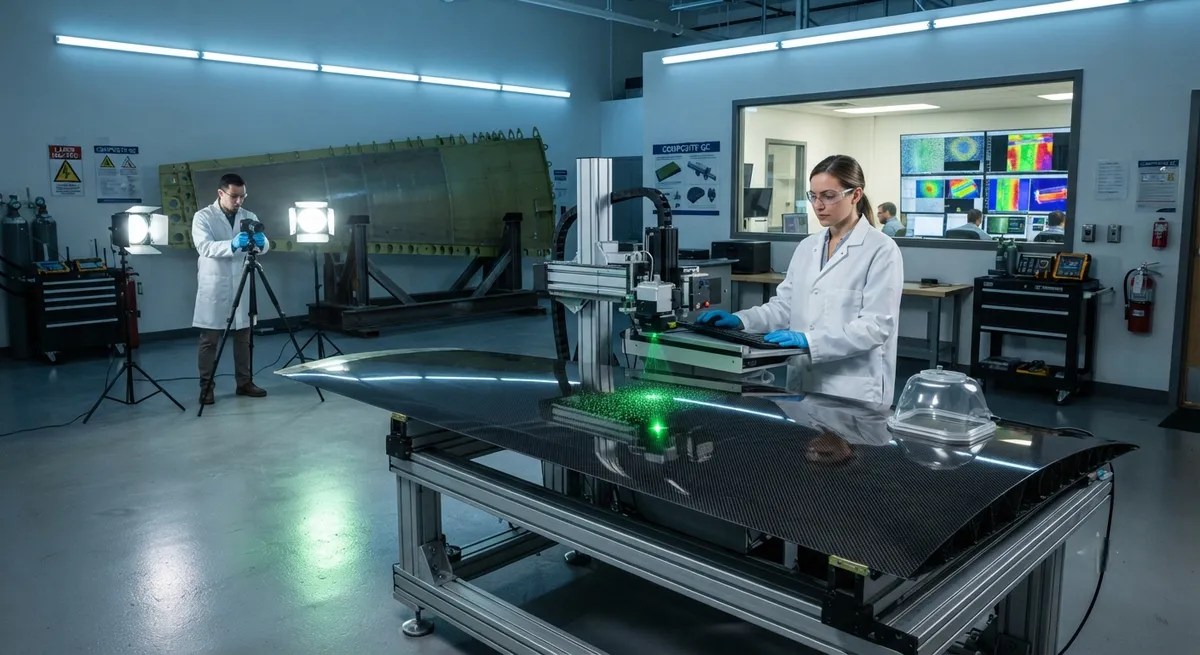
A bonded carbon fiber assembly only earns its certificate after inspection proves that hidden delaminations, disbonds, and core crush never happened. Ultrasonic testing and radiography were the standard tools for decades, both point-by-point and slow. Two full-field optical methods now dominate production-rate inspection of carbon fiber composites: shearography and infrared thermography. They find different defects at different speeds, and QC teams increasingly treat them as complementary rather than rivals.
How Shearography Works
Shearography is a laser interferometry technique. Coherent laser light illuminates the part, and a shearing element splits the image into two offset copies that interfere on a CCD or CMOS sensor. The resulting speckle pattern encodes the surface deformation gradient, the out-of-plane strain, at every pixel. The operator captures a baseline frame, applies a load, then captures a second frame; subtracting them yields a fringe map of strain anomalies.
The load drives defect visibility. Disbonds and delaminations do not transfer load across the defect boundary, so they deform differently from surrounding sound material under stress. Common loading methods:
- Thermal loading: infrared lamps or hot air raise the surface temperature a few degrees, creating differential expansion around defects with low thermal contact.
- Vacuum loading: a small pressure drop of 20 to 100 mbar in a chamber or hood bulges subsurface voids and delaminations outward.
- Mechanical loading: bending or pressurization deforms the structure enough to reveal defects in stiff bonded assemblies.
Because shearography measures strain gradients rather than temperature, it barely reacts to emissivity, surface finish, or paint color. That keeps results stable on glossy parts straight from the tool.
How Thermography Works
Flash thermography is the other production workhorse. Two xenon flash lamps deliver a short pulse to the surface, and an infrared camera records the surface temperature decay over the following seconds. Defects that contain air act as thermal barriers, trapping heat above them and creating a warm spot that grows and then fades. The time window in which the anomaly appears reveals its depth.
Carbon fiber reinforced polymer conducts heat poorly. The in-plane thermal conductivity of a typical aerospace laminate is roughly 5 to 10 times lower than metals such as steel or titanium, and through-thickness conductivity is lower still, about 0.5 to 1 W/m·K. Heat does not travel far in the milliseconds available to a flash test, and this physical limit sets the inspection depth.
Defect Detection Capabilities
Both methods are full-field, so one acquisition covers the whole camera field of view instead of a scanned point. They differ strongly in which defects they expose:
- Shearography: strongest on bonded-joint disbonds, skin-to-honeycomb disbonds, delaminations, and core crush. It responds to stiffness change, catching surface and near-surface defects.
- Thermography: strongest on delaminations, impact damage, porosity, disbonds, and water ingress in honeycomb cells. Any air gap in the heat path appears.
- Porosity: micro-porosity slows heat flow and reads as a diffuse warm area in thermography; shearography needs heavy loading to reveal it, which is harder.
Production-Rate Speed Comparison
The headline number for QC managers is square meters per hour, driven by part size, defect threshold, and loading cycle time.
| Parameter | Shearography | Flash Thermography |
|---|---|---|
| Typical inspection rate | 6 to 30 m² per hour (0.1 to 0.5 m² per minute) | 60 to 300 m² per hour (1 to 5 m² per minute) |
| Single-part cycle time | 1 to 5 minutes including load application | 5 to 30 seconds per frame sequence |
| Field of view per shot | 0.1 to 1 m² | 0.1 to 1 m² |
| Surface preparation | None, works on painted surfaces | None, but emissivity and reflections matter |
| Throughput driver | Mechanical or thermal loading time | Flash recharge and cooling time |
| Best fit | Bonded joints, bonded repairs | Large skins, panels, honeycomb cores |
For a large honeycomb panel, thermography inspects in seconds per station, while shearography needs a load cycle between acquisitions. When parts number in the thousands per month, that difference decides line capacity.
Sensitivity and Depth Limits
Sensitivity is measured by the smallest defect a method reliably finds at a given depth.
| Characteristic | Shearography | Flash Thermography |
|---|---|---|
| Smallest detectable defect | Roughly 2 to 5 mm diameter disbonds in the surface layer | 2 to 10 mm diameter depending on depth |
| Depth of inspection | Surface to a few mm; set by defect size versus stiffness contrast | 1 to 3 mm in carbon fiber for flash; deeper with lock-in |
| Depth information | Limited, degrades with depth | Time-based, allows depth estimation |
| Influence of surface finish | Low | High: emissivity and reflections dominate |
Neither method sees through thick carbon fiber the way radiography or ultrasonic does. Thermography's ceiling sits a few millimeters into CFRP because anisotropic conductivity dampens the thermal wave fast. Shearography's ceiling depends on defect size, stiffness contrast, and applied load; small deep defects produce no measurable strain anomaly.
Advantages and Disadvantages
- Shearography advantages: non-contact, full-field, immune to surface finish, measures mechanical response directly.
- Shearography disadvantages: needs a loading mechanism, rejects vibration, slower cycle time, shallow depth.
- Thermography advantages: very high throughput, contact-free, no loading fixture, one-sided access.
- Thermography disadvantages: sensitive to emissivity and reflections, shallow depth ceiling, needs uniform heating.
When to Choose Which
Choose thermography first when throughput rules, the structure is thin, and the area is large, such as fuselage skins, fairings, and honeycomb panels in serial production. Choose shearography when bond integrity is the priority, such as bonded repairs, co-cured stiffener runs, or joints where a disbond is the certification risk and a controlled load is available. For bonded patch repairs on aircraft in service, shearography with vacuum loading is the standard field procedure because it tolerates painted surfaces.
Hybrid Systems and Standards
Production lines increasingly combine both cameras in one gantry. The thermography head screens large areas fast and flags anomalies; the shearography head then interrogates each flagged region under controlled load.
Two ASTM standards anchor the methods. ASTM E2581 covers shearography of composites and sandwich cores. ASTM E2582 covers flash thermography of composite panels. Qualification programs for critical parts write acceptance criteria around these documents, using calibration panels with seeded defects of known size and depth.
Frequently Asked Questions
Which method is faster for aerospace carbon fiber inspection?
Flash thermography covers area roughly 10 to 20 times faster, 1 to 5 m² per minute versus 0.1 to 0.5 m² per minute, because it needs no loading cycle between acquisitions.
How deep can shearography and thermography detect defects in carbon fiber?
Both are near-surface methods in carbon fiber. Flash thermography reliably sees defects 1 to 3 mm deep, while shearography detects defects a few millimeters deep depending on defect size, stiffness contrast, and applied load.
Can one method replace the other on an aerospace production line?
Not completely. Thermography screens large thin panels quickly and finds thermal-barrier defects, while shearography verifies bond integrity under load. Many facilities run both in a hybrid gantry.
Conclusion
Shearography and thermography are not rivals so much as two full-field cameras reading different physics. Shearography sees strain gradients under load and certifies bond integrity; thermography sees thermal barriers at high speed and screens large thin areas. Choose based on defect priority, part thickness, and parts per month, or on hybrid systems that use both.
YongXian supplies aerospace-grade carbon fiber materials. Explore our carbon fiber product range or contact our engineering team to discuss materials matched to your inspection program.
Part of topic
Related Articles
- Bio-Based Carbon Fiber Precursors: Lignin and Polyethylene for Low-Cost Production
- Large-Tow Carbon Fiber Cost Analysis: 48K vs 60K Price-Performance Comparison
- Carbon Fiber-Resin Interface Bonding: Surface Treatment and Coupling Agent Optimization
- Digital Twin for Carbon Fiber Manufacturing: Real-Time Process Monitoring and Defect Prevention
- Thermoplastic Carbon Fiber Welding for Automotive: Ultrasonic and Induction Welding Process Windows
- Large-Tow Carbon Fiber Wet Spinning: Process Optimization for 48K/60K Production Efficiency
Interested in Our Products?
Contact our team for competitive pricing and technical specifications.
Get a QuoteRelated Products
Carbon fiber standard plate-3k stripe
Lightweight, ultra-rigid standard sheets for drone fuselages, robot housings, facades and structural applications.
Carbon Fiber Plate — 3K Twill T700 3.0mm
Medium-thickness 3.0mm carbon fiber plate offering significantly higher load capacity while maintaining attractive 3K twill finish. Suitable for structural brackets, reinforcement plates, and load-bearing panels.
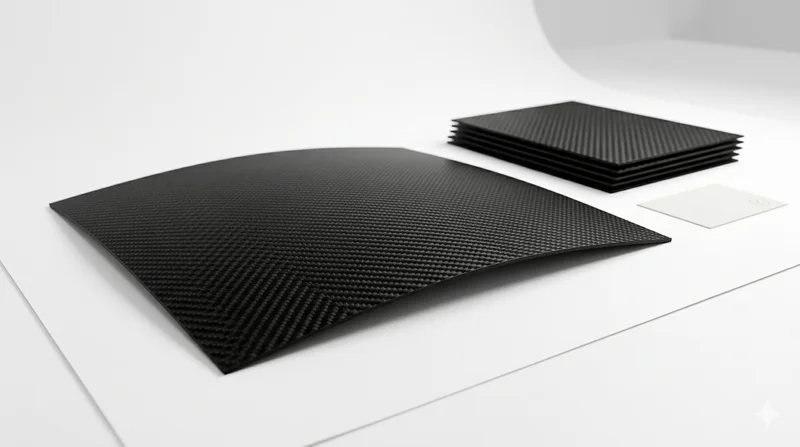
Carbon Fiber Plate — 3K Twill T700 1.5mm
Thin 1.5mm carbon fiber plate with 3K twill weave surface. Lightweight and stiff, commonly used for covers, panels, drone bodies, and applications requiring a premium aesthetic appearance.
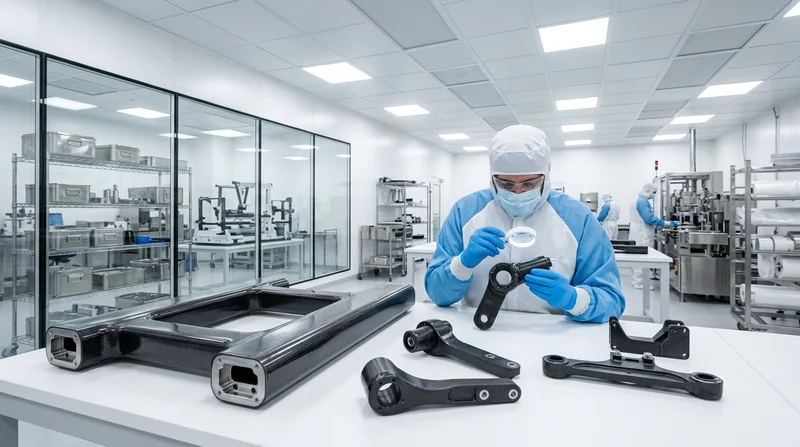
Custom Carbon Fiber Medical Device Components
Medical-grade carbon fiber components manufactured for imaging equipment, surgical instruments, and patient support systems. Carbon fiber's radiolucency (X-ray transparency) and high strength-to-weight ratio make it ideal for CT scanner beds, wheelchair frames, surgical robot arms, and MRI-compatible accessories. Biocompatible resin systems available.
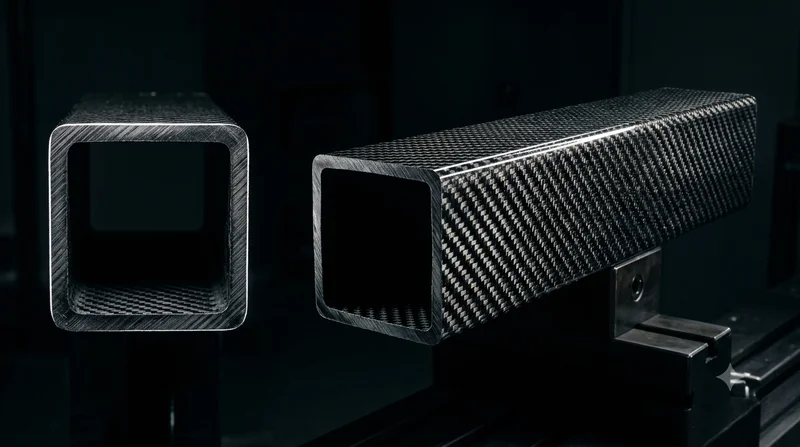
Square Carbon Fiber Tube — 3K Twill T700
Square cross-section carbon fiber tube manufactured with 3K twill weave for torsional strength. Preferred for structural frames, trusses, and support columns where rectangular geometry offers design flexibility.