Composite laminates fail their analysis allowances most often through manufacturing variability, and the largest contributor is fiber orientation error. A unidirectional ply intended at zero degrees but placed at two degrees loses measurable stiffness; cross-ply and angle-ply laminates
Introduction
Composite laminates fail their analysis allowances most often through manufacturing variability, and the largest contributor is fiber orientation error. A unidirectional ply intended at zero degrees but placed at two degrees loses measurable stiffness; cross-ply and angle-ply laminates are even more sensitive because each off-angle ply shifts the load path through the whole stack. Industry experience puts the effect in a painful range: one to two degrees of fiber angle deviation can reduce stiffness by five to fifteen percent, depending on the laminate, which is enough to consume a design's knockdown factor before the part ever leaves the shop floor.
Automated fiber placement has made the problem both more visible and more solvable. AFP machines can place thousands of meters of tow per hour, and with that speed comes the risk of tow steering, gapping, overlap, and angle drift. The answer is measurement: in-process camera systems that watch every tow as it lands, surface optical methods that check the finished ply stack, and X-ray computed tomography that resolves fiber orientation through the full laminate thickness. This article explains how each method works, what it measures, and where it belongs in a production QC workflow.
Why Fiber Angle Accuracy Drives Structural Performance
Classical laminate theory treats each ply as a layer whose stiffness is a function of its fiber angle, and the assembled laminate combines those layers in a precise load-sharing balance. When a ply sits at the wrong angle, three things happen at once: it carries less load along the design direction, it adds parasitic stiffness in unintended directions, and it changes the coupling behavior of the stack. Off-axis plies amplify the error because their angle terms multiply sensitivity — a two-degree error in a ply placed at 45 degrees shifts the ply's stiffness matrix more than the same error at 0 or 90 degrees.
Compression and buckling performance are where the penalty shows up first. Post-buckled panels and stiffened skins rely on exact load paths, and waviness or angle drift in the load-bearing plies reduces local stiffness enough to change buckling onset. Designers compensate with knockdown factors, but every percentage point of knockdown borrowed for manufacturing variability is a percentage point of structure that cannot be used for payload.
In-Process Measurement During Automated Fiber Placement
AFP heads today carry optical sensors that do not wait for a post-layup inspection — they measure while the tow lands. Two families of sensors dominate:
- Tow-edge camera systems: Linescan or area cameras mounted on the placement head image each tow as it is placed, identifying gap and overlap width to tens of micrometers and tracking the tow centerline angle as the head steers around the tool surface.
- Laser and structured-light profilometry: A laser line swept across the freshly placed tow measures surface height across the band, detecting wrinkles, edge lift, and the local angle of each tow relative to the design path.
In-process data closes the loop with the machine controller: angle drift beyond tolerance flags the head for adjustment mid-course, and gap or overlap reports become part of the as-manufactured record for every ply. The key advantage is coverage — every meter of every tow is measured, not a sampled coupon.
Surface Optical Methods After Layup
Once the ply stack is complete and consolidated, optical inspection moves from the AFP head to the placed surface. Surface methods read the visible evidence of fiber orientation: the direction of fiber ridges and reflections on the uppermost plies.
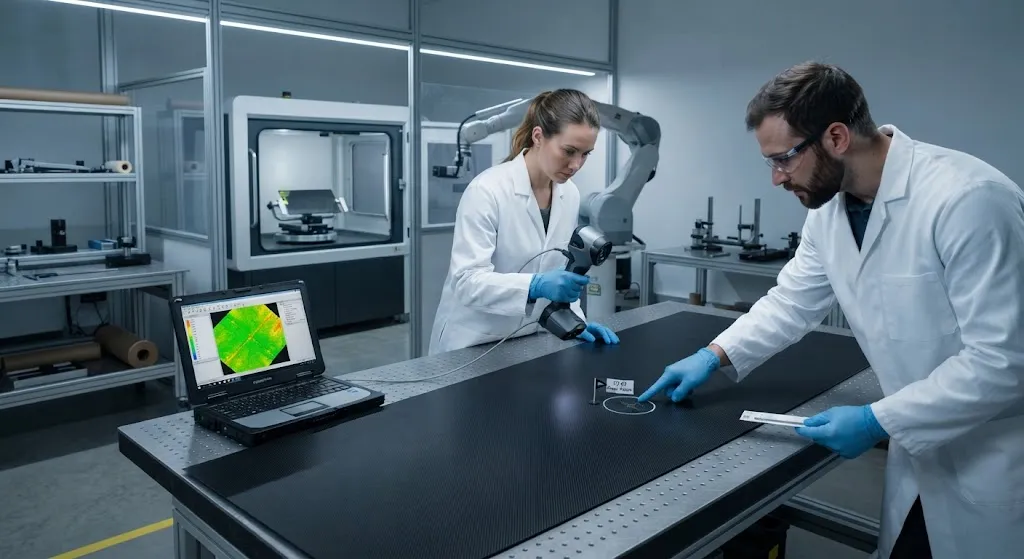
- Specular reflection analysis: Carbon fiber surfaces reflect light anisotropically along the fiber direction. A fixed light source and camera capture the reflection pattern, and image processing extracts the local fiber angle of the surface plies.
- Photogrammetry of surface texture: High-resolution stereo imaging reconstructs the surface relief and measures fiber ridge direction, including localized waviness that can precede buckling or wrinkle defects.
- Laser profilometry: A scanning laser measures the surface height map; directional analysis of the height gradient yields ply orientation and detects surface-level fiber misalignment.
Surface methods are fast, non-contact, and cover large areas in minutes, which makes them ideal for first-article inspection and batch sampling. Their limitation is depth: they see the top one or two plies, so errors buried in the middle of a thick stack can pass surface inspection entirely.
X-Ray Computed Tomography for Volumetric Orientation
For pressure vessels, thick laminates, and parts where interior angle drift would be catastrophic, X-ray computed tomography provides the full picture. A CT scan reconstructs the three-dimensional density field of a coupon or a full part, and fiber orientation analysis software — based on structure-tensor or Fourier-domain algorithms — computes a volumetric fiber orientation vector for every voxel.
| Method | Measures | Coverage | Typical Accuracy | Time to Result | Relative Cost |
|---|---|---|---|---|---|
| In-process AFP camera | Tow angle, gap, overlap during placement | Every tow, every ply | Tens of micrometers positioning | Real time | Integrated in machine |
| Surface optical scan | Surface ply angles, waviness | Full surface, top plies | 0.1-0.5 degrees typical | Minutes per part | Low to medium |
| X-ray CT with orientation analysis | Volumetric fiber orientation, waviness, voids | Coupons or full parts | Voxel-level orientation fields | Hours per coupon | High |
CT answers the questions surface methods cannot: whether a ply steered in the middle of the stack, whether the angle gradient across the thickness matches the design, and how waviness and void content interact with orientation error. Aerospace programs use it for qualification of new AFP programs, for failure analysis when a part misses allowables, and for building the statistical dataset that justifies reducing knockdown factors on future designs.
Building a Practical QC Workflow
The three methods are complementary, and production programs use them in layers:
- First article: CT scan a sacrificial coupon or the first part of a new program to map volumetric orientation; correlate it with surface scans so the cheaper surface method stands in for the expensive one on subsequent parts.
- Every part: Rely on in-process AFP camera data as the go/no-go gate during placement; investigate any tow whose angle or gap history exceeds the program threshold.
- Batch sampling: Surface optical inspection on a rotating sample of production parts tracks statistical drift before it produces reject parts.
- Failure analysis: When a part misses strength or stiffness allowables, CT pinpoints whether orientation variability — rather than porosity or fiber volume — caused the shortfall.
The output of every layer should feed a shared database keyed to ply and part identity, so that measured orientation is linked to test results and final performance. That linkage is what turns orientation measurement from a documentation burden into a design optimization asset.
Frequently Asked Questions
How much do fiber angle errors actually affect carbon fiber laminate stiffness?
The effect depends on the laminate, but industry data consistently shows that one to two degrees of fiber angle deviation changes stiffness by roughly five to fifteen percent. Off-axis plies are most sensitive because their stiffness matrices rotate most strongly with angle, and compression and buckling behavior degrade first. This is why high-performance programs treat orientation as a measured property rather than an assumption.
Can optical surface inspection detect fiber misalignment inside thick laminates?
No. Surface optical methods read only the top one or two plies, so mid-stack tow steering and angle drift can be invisible to them. In-process AFP cameras cover every ply as it is placed, and X-ray CT provides volumetric orientation data for coupons and full parts. Programs that rely only on surface inspection assume interior accuracy without evidence.
What is the difference between in-process AFP inspection and post-layup inspection?
In-process AFP inspection measures each tow as the placement head lays it, catching steering, gap, and overlap in real time with full coverage and immediate feedback to the machine controller. Post-layup inspection measures the finished surface or a scanned volume, providing independent verification of the as-built ply stack. The two are complementary: in-process data is the production gate, post-layup data is the independent verification.
Is X-ray CT practical for routine production quality control?
CT is slow and expensive per part, so routine production QC typically uses it selectively: for first articles, for qualification of new placement programs, and for failure analysis. The statistical correlation between CT volumetric data and faster surface scans lets programs calibrate the cheap, fast methods against the gold standard and then run them at production frequency.
Conclusion
Fiber orientation measurement has moved from a research curiosity to a production-grade quality control discipline. In-process AFP cameras watch every tow land and close the loop with the placement head; surface optical methods audit finished ply stacks in minutes; and X-ray CT resolves orientation through the full thickness when interior accuracy must be proven. Layered together, the three methods convert orientation variability from a hidden risk into a measured, managed, and continuously improving quantity. For programs that push laminates to their design allowables — pressure vessels, aircraft structure, and high-performance sporting goods — that conversion is worth real money, because every percentage point of stiffness and strength that no longer needs a variability knockdown is payload that goes back into the product.
Browse YongXian's carbon fiber materials for AFP and hand layup programs, or contact our engineering team for tow grades, prepreg vouchers, and material consistency data that support your orientation QC program.
Related Articles
- How Are Carbon Fiber Parts Made: Complete Guide
- Filament Wound Tube: Complete Guide
- Filament Wound FRP Pipe: Complete Guide
- Filament Wound Epoxy Tubes: Complete Guide
- Pultruded Carbon Fibre Rods: Cross-Sectional Properties and Standard Sizes
- Carbon Fiber Tube Fittings and Connectors: Joining Solutions for Structural Assemblies
Interested in Our Products?
Contact our team for competitive pricing and technical specifications.
Get a QuoteRelated Products
Carbon Fiber Fishing Rod Blank
High-quality carbon fiber fishing rod blank manufactured from multiple grades of Toray carbon fiber cloth. Available in a wide range of lengths, powers, and actions for freshwater and saltwater applications. Suitable for OEM rod building.
Carbon Fiber Plate — 3K Twill T700 3.0mm
Medium-thickness 3.0mm carbon fiber plate offering significantly higher load capacity while maintaining attractive 3K twill finish. Suitable for structural brackets, reinforcement plates, and load-bearing panels.
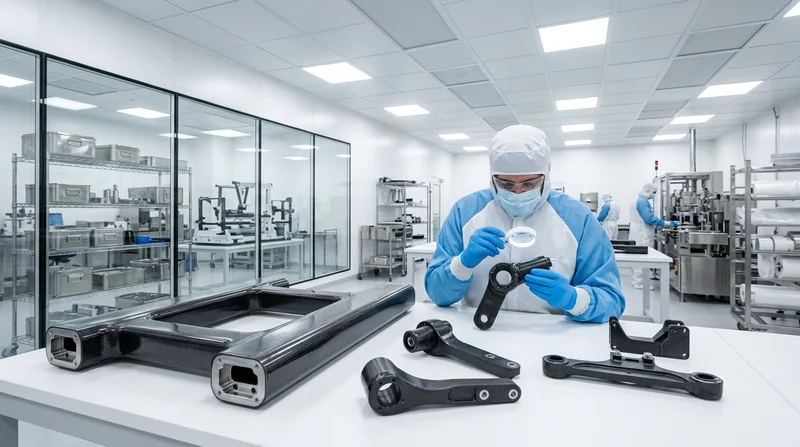
Custom Carbon Fiber Medical Device Components
Medical-grade carbon fiber components manufactured for imaging equipment, surgical instruments, and patient support systems. Carbon fiber's radiolucency (X-ray transparency) and high strength-to-weight ratio make it ideal for CT scanner beds, wheelchair frames, surgical robot arms, and MRI-compatible accessories. Biocompatible resin systems available.
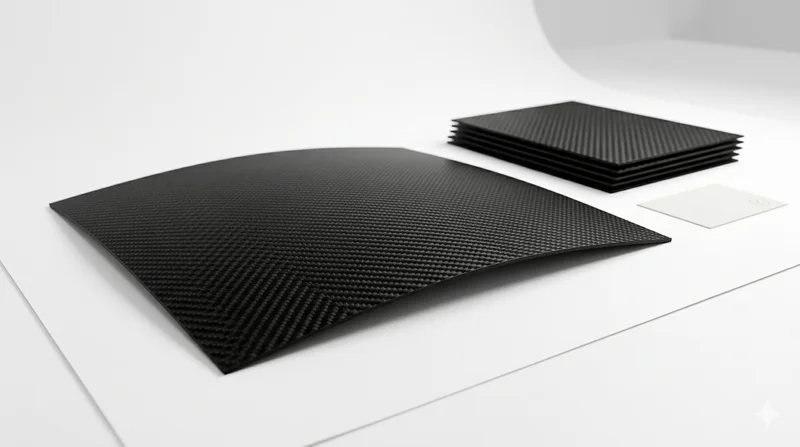
Carbon Fiber Plate — 3K Twill T700 1.5mm
Thin 1.5mm carbon fiber plate with 3K twill weave surface. Lightweight and stiff, commonly used for covers, panels, drone bodies, and applications requiring a premium aesthetic appearance.
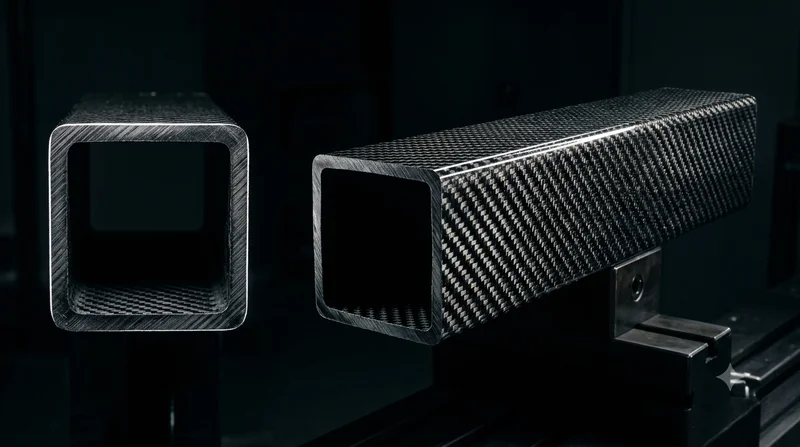
Square Carbon Fiber Tube — 3K Twill T700
Square cross-section carbon fiber tube manufactured with 3K twill weave for torsional strength. Preferred for structural frames, trusses, and support columns where rectangular geometry offers design flexibility.